Hmong vs German Seniors Poverty Over the Age of 65
COMPARE
Hmong
German
Seniors Poverty Over the Age of 65
Seniors Poverty Over the Age of 65 Comparison
Hmong
Germans
10.4%
SENIORS POVERTY OVER THE AGE OF 65
90.0/ 100
METRIC RATING
123rd/ 347
METRIC RANK
9.0%
SENIORS POVERTY OVER THE AGE OF 65
100.0/ 100
METRIC RATING
7th/ 347
METRIC RANK
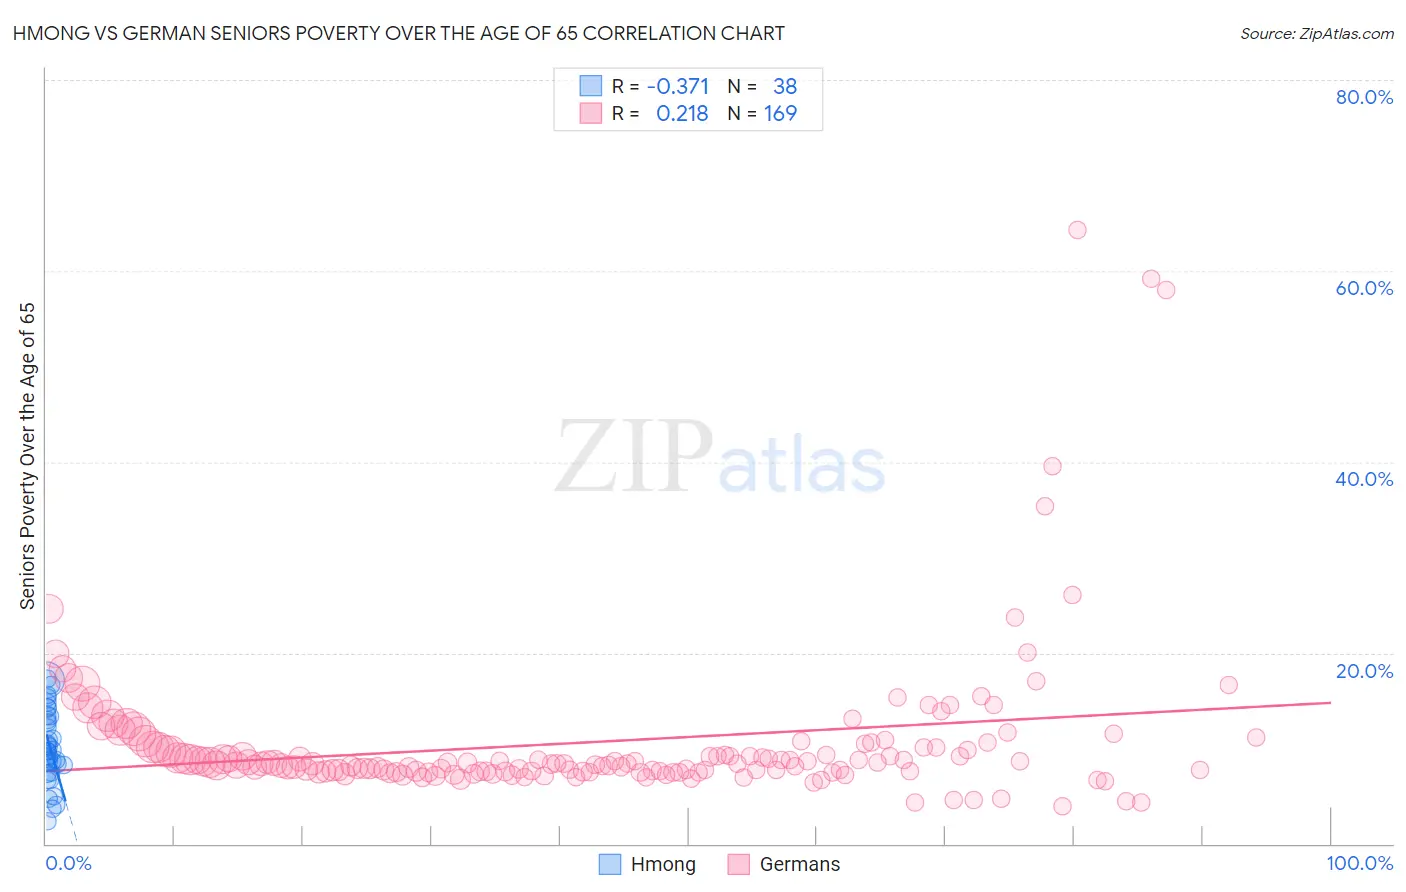
Hmong vs German Seniors Poverty Over the Age of 65 Correlation Chart
The statistical analysis conducted on geographies consisting of 24,669,739 people shows a mild negative correlation between the proportion of Hmong and poverty level among seniors over the age of 65 in the United States with a correlation coefficient (R) of -0.371 and weighted average of 10.4%. Similarly, the statistical analysis conducted on geographies consisting of 574,200,569 people shows a weak positive correlation between the proportion of Germans and poverty level among seniors over the age of 65 in the United States with a correlation coefficient (R) of 0.218 and weighted average of 9.0%, a difference of 16.2%.
Seniors Poverty Over the Age of 65 Correlation Summary
| Measurement | Hmong | German |
| Minimum | 2.3% | 3.9% |
| Maximum | 17.3% | 64.3% |
| Range | 15.0% | 60.4% |
| Mean | 10.2% | 10.7% |
| Median | 9.7% | 8.4% |
| Interquartile 25% (IQ1) | 8.2% | 7.6% |
| Interquartile 75% (IQ3) | 13.4% | 10.1% |
| Interquartile Range (IQR) | 5.2% | 2.5% |
| Standard Deviation (Sample) | 3.9% | 8.2% |
| Standard Deviation (Population) | 3.8% | 8.2% |
Similar Demographics by Seniors Poverty Over the Age of 65
Demographics Similar to Hmong by Seniors Poverty Over the Age of 65
In terms of seniors poverty over the age of 65, the demographic groups most similar to Hmong are Asian (10.4%, a difference of 0.030%), Immigrants from Philippines (10.4%, a difference of 0.17%), Immigrants from Iraq (10.4%, a difference of 0.18%), Immigrants from Moldova (10.4%, a difference of 0.18%), and Immigrants from Bosnia and Herzegovina (10.4%, a difference of 0.22%).
| Demographics | Rating | Rank | Seniors Poverty Over the Age of 65 |
| Pakistanis | 92.2 /100 | #116 | Exceptional 10.3% |
| Lebanese | 92.0 /100 | #117 | Exceptional 10.3% |
| Okinawans | 91.7 /100 | #118 | Exceptional 10.4% |
| Immigrants | Western Europe | 91.1 /100 | #119 | Exceptional 10.4% |
| Immigrants | Bosnia and Herzegovina | 90.8 /100 | #120 | Exceptional 10.4% |
| Immigrants | Iraq | 90.7 /100 | #121 | Exceptional 10.4% |
| Immigrants | Moldova | 90.7 /100 | #122 | Exceptional 10.4% |
| Hmong | 90.0 /100 | #123 | Exceptional 10.4% |
| Asians | 89.9 /100 | #124 | Excellent 10.4% |
| Immigrants | Philippines | 89.4 /100 | #125 | Excellent 10.4% |
| Immigrants | Hungary | 89.1 /100 | #126 | Excellent 10.4% |
| Cambodians | 89.1 /100 | #127 | Excellent 10.4% |
| Ottawa | 88.5 /100 | #128 | Excellent 10.4% |
| Immigrants | Iran | 88.4 /100 | #129 | Excellent 10.4% |
| Immigrants | Oceania | 88.4 /100 | #130 | Excellent 10.4% |
Demographics Similar to Germans by Seniors Poverty Over the Age of 65
In terms of seniors poverty over the age of 65, the demographic groups most similar to Germans are Czech (9.0%, a difference of 0.53%), English (9.1%, a difference of 1.2%), Lithuanian (9.1%, a difference of 1.3%), Danish (8.8%, a difference of 1.6%), and Maltese (9.1%, a difference of 1.7%).
| Demographics | Rating | Rank | Seniors Poverty Over the Age of 65 |
| Chinese | 100.0 /100 | #1 | Exceptional 8.3% |
| Tlingit-Haida | 100.0 /100 | #2 | Exceptional 8.3% |
| Norwegians | 100.0 /100 | #3 | Exceptional 8.7% |
| Swedes | 100.0 /100 | #4 | Exceptional 8.7% |
| Immigrants | India | 100.0 /100 | #5 | Exceptional 8.8% |
| Danes | 100.0 /100 | #6 | Exceptional 8.8% |
| Germans | 100.0 /100 | #7 | Exceptional 9.0% |
| Czechs | 100.0 /100 | #8 | Exceptional 9.0% |
| English | 100.0 /100 | #9 | Exceptional 9.1% |
| Lithuanians | 100.0 /100 | #10 | Exceptional 9.1% |
| Maltese | 99.9 /100 | #11 | Exceptional 9.1% |
| Scandinavians | 99.9 /100 | #12 | Exceptional 9.1% |
| Croatians | 99.9 /100 | #13 | Exceptional 9.1% |
| Poles | 99.9 /100 | #14 | Exceptional 9.1% |
| Dutch | 99.9 /100 | #15 | Exceptional 9.1% |