Welsh vs German In Labor Force | Age 35-44
COMPARE
Welsh
German
In Labor Force | Age 35-44
In Labor Force | Age 35-44 Comparison
Welsh
Germans
84.0%
IN LABOR FORCE | AGE 35-44
5.3/ 100
METRIC RATING
228th/ 347
METRIC RANK
84.7%
IN LABOR FORCE | AGE 35-44
91.0/ 100
METRIC RATING
122nd/ 347
METRIC RANK
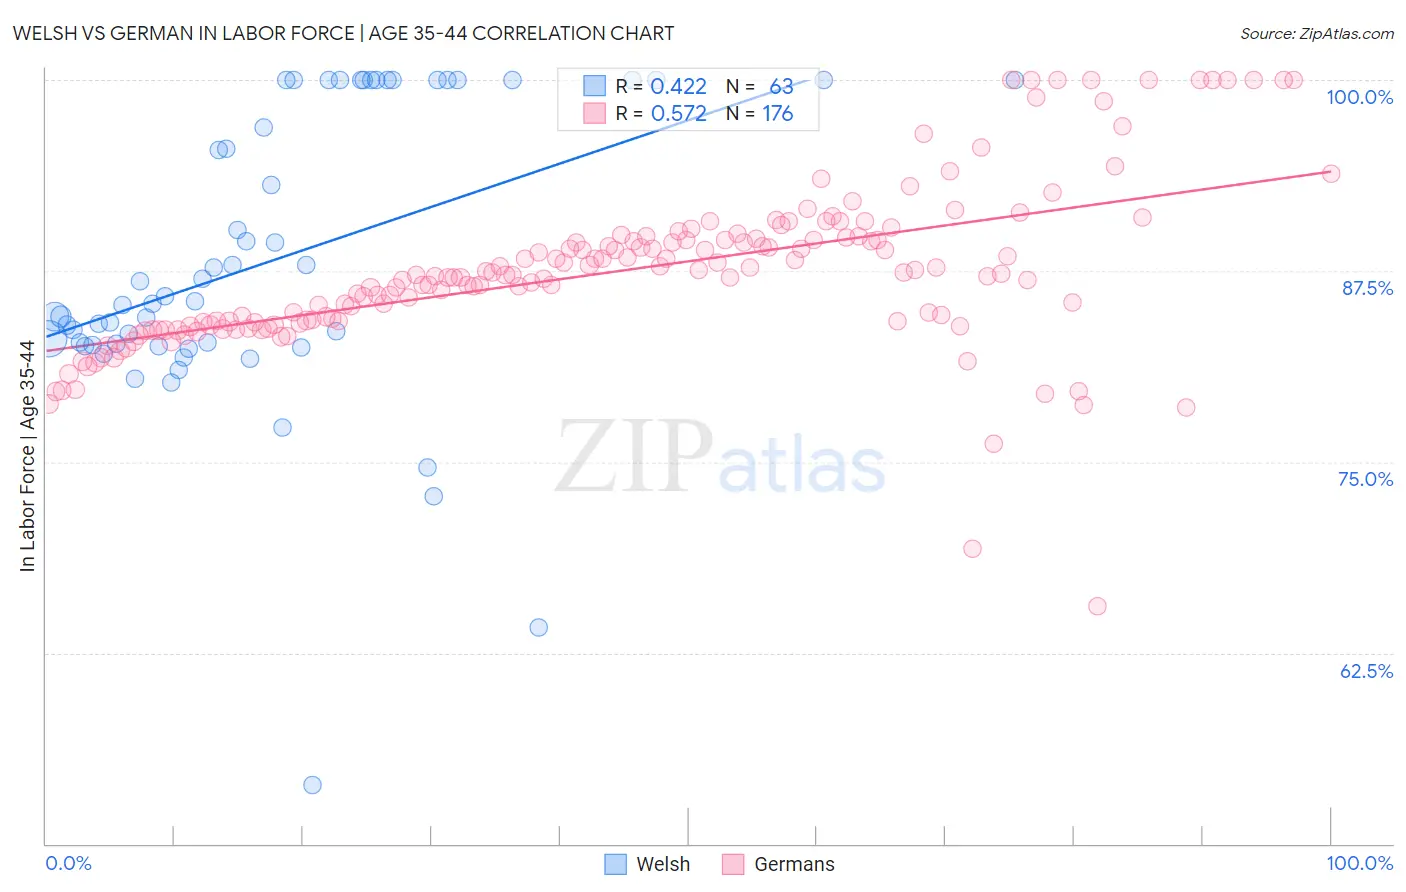
Welsh vs German In Labor Force | Age 35-44 Correlation Chart
The statistical analysis conducted on geographies consisting of 528,172,849 people shows a moderate positive correlation between the proportion of Welsh and labor force participation rate among population between the ages 35 and 44 in the United States with a correlation coefficient (R) of 0.422 and weighted average of 84.0%. Similarly, the statistical analysis conducted on geographies consisting of 580,230,467 people shows a substantial positive correlation between the proportion of Germans and labor force participation rate among population between the ages 35 and 44 in the United States with a correlation coefficient (R) of 0.572 and weighted average of 84.7%, a difference of 0.85%.
In Labor Force | Age 35-44 Correlation Summary
| Measurement | Welsh | German |
| Minimum | 53.9% | 65.5% |
| Maximum | 100.0% | 100.0% |
| Range | 46.1% | 34.5% |
| Mean | 88.2% | 87.5% |
| Median | 85.5% | 87.2% |
| Interquartile 25% (IQ1) | 82.7% | 84.1% |
| Interquartile 75% (IQ3) | 100.0% | 89.6% |
| Interquartile Range (IQR) | 17.3% | 5.5% |
| Standard Deviation (Sample) | 9.7% | 5.4% |
| Standard Deviation (Population) | 9.6% | 5.4% |
Similar Demographics by In Labor Force | Age 35-44
Demographics Similar to Welsh by In Labor Force | Age 35-44
In terms of in labor force | age 35-44, the demographic groups most similar to Welsh are Panamanian (84.0%, a difference of 0.0%), British West Indian (84.0%, a difference of 0.0%), U.S. Virgin Islander (84.0%, a difference of 0.020%), Immigrants from Burma/Myanmar (84.0%, a difference of 0.020%), and Immigrants from Thailand (84.0%, a difference of 0.020%).
| Demographics | Rating | Rank | In Labor Force | Age 35-44 |
| Icelanders | 6.7 /100 | #221 | Tragic 84.0% |
| Assyrians/Chaldeans/Syriacs | 6.6 /100 | #222 | Tragic 84.0% |
| Immigrants | Panama | 6.4 /100 | #223 | Tragic 84.0% |
| U.S. Virgin Islanders | 6.1 /100 | #224 | Tragic 84.0% |
| Immigrants | Burma/Myanmar | 6.1 /100 | #225 | Tragic 84.0% |
| Panamanians | 5.4 /100 | #226 | Tragic 84.0% |
| British West Indians | 5.3 /100 | #227 | Tragic 84.0% |
| Welsh | 5.3 /100 | #228 | Tragic 84.0% |
| Immigrants | Thailand | 4.7 /100 | #229 | Tragic 84.0% |
| Immigrants | Iraq | 3.7 /100 | #230 | Tragic 83.9% |
| Scottish | 3.2 /100 | #231 | Tragic 83.9% |
| Native Hawaiians | 3.0 /100 | #232 | Tragic 83.9% |
| Immigrants | Germany | 2.8 /100 | #233 | Tragic 83.9% |
| Immigrants | Oceania | 2.6 /100 | #234 | Tragic 83.9% |
| Immigrants | Syria | 2.5 /100 | #235 | Tragic 83.9% |
Demographics Similar to Germans by In Labor Force | Age 35-44
In terms of in labor force | age 35-44, the demographic groups most similar to Germans are Finnish (84.7%, a difference of 0.0%), Immigrants from South America (84.7%, a difference of 0.0%), Slavic (84.7%, a difference of 0.0%), Burmese (84.7%, a difference of 0.010%), and Immigrants from Northern Europe (84.7%, a difference of 0.010%).
| Demographics | Rating | Rank | In Labor Force | Age 35-44 |
| Bahamians | 93.2 /100 | #115 | Exceptional 84.7% |
| Immigrants | Egypt | 92.7 /100 | #116 | Exceptional 84.7% |
| Immigrants | China | 92.3 /100 | #117 | Exceptional 84.7% |
| Immigrants | Eastern Asia | 92.1 /100 | #118 | Exceptional 84.7% |
| Burmese | 91.8 /100 | #119 | Exceptional 84.7% |
| Immigrants | Northern Europe | 91.5 /100 | #120 | Exceptional 84.7% |
| Finns | 91.2 /100 | #121 | Exceptional 84.7% |
| Germans | 91.0 /100 | #122 | Exceptional 84.7% |
| Immigrants | South America | 90.9 /100 | #123 | Exceptional 84.7% |
| Slavs | 90.8 /100 | #124 | Exceptional 84.7% |
| Maltese | 90.8 /100 | #125 | Exceptional 84.7% |
| Asians | 90.6 /100 | #126 | Exceptional 84.7% |
| Immigrants | Spain | 90.6 /100 | #127 | Exceptional 84.7% |
| Immigrants | Ghana | 90.4 /100 | #128 | Exceptional 84.7% |
| Palestinians | 89.7 /100 | #129 | Excellent 84.7% |