Austrian vs German In Labor Force | Age 35-44
COMPARE
Austrian
German
In Labor Force | Age 35-44
In Labor Force | Age 35-44 Comparison
Austrians
Germans
84.7%
IN LABOR FORCE | AGE 35-44
89.4/ 100
METRIC RATING
132nd/ 347
METRIC RANK
84.7%
IN LABOR FORCE | AGE 35-44
91.0/ 100
METRIC RATING
122nd/ 347
METRIC RANK
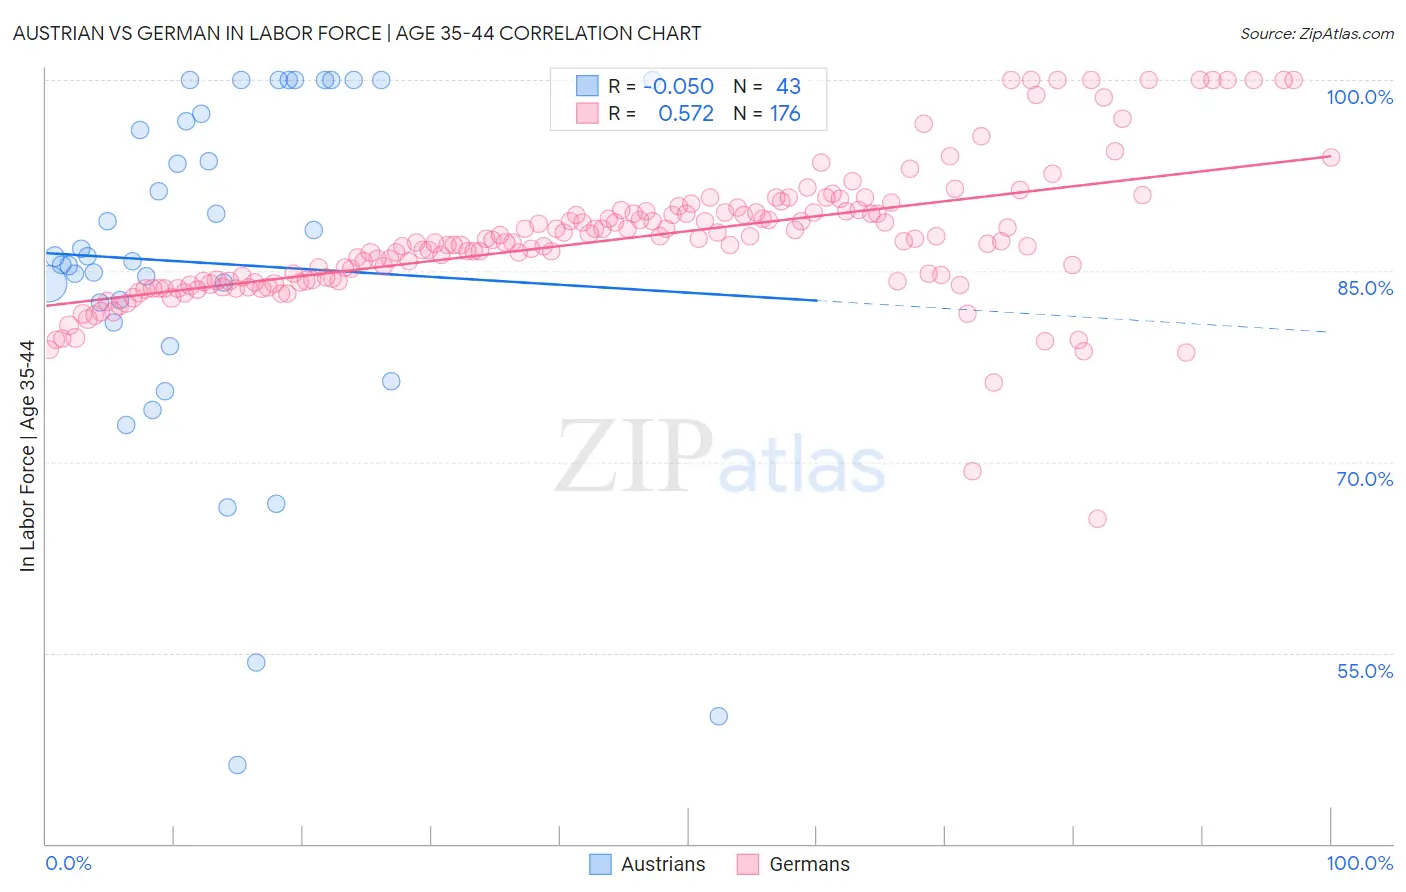
Austrian vs German In Labor Force | Age 35-44 Correlation Chart
The statistical analysis conducted on geographies consisting of 451,816,853 people shows a slight negative correlation between the proportion of Austrians and labor force participation rate among population between the ages 35 and 44 in the United States with a correlation coefficient (R) of -0.050 and weighted average of 84.7%. Similarly, the statistical analysis conducted on geographies consisting of 580,230,467 people shows a substantial positive correlation between the proportion of Germans and labor force participation rate among population between the ages 35 and 44 in the United States with a correlation coefficient (R) of 0.572 and weighted average of 84.7%, a difference of 0.030%.
In Labor Force | Age 35-44 Correlation Summary
| Measurement | Austrian | German |
| Minimum | 46.2% | 65.5% |
| Maximum | 100.0% | 100.0% |
| Range | 53.8% | 34.5% |
| Mean | 85.6% | 87.5% |
| Median | 86.1% | 87.2% |
| Interquartile 25% (IQ1) | 81.0% | 84.1% |
| Interquartile 75% (IQ3) | 97.4% | 89.6% |
| Interquartile Range (IQR) | 16.4% | 5.5% |
| Standard Deviation (Sample) | 13.6% | 5.4% |
| Standard Deviation (Population) | 13.4% | 5.4% |
Demographics Similar to Austrians and Germans by In Labor Force | Age 35-44
In terms of in labor force | age 35-44, the demographic groups most similar to Austrians are Palestinian (84.7%, a difference of 0.0%), Bhutanese (84.7%, a difference of 0.0%), Immigrants from Scotland (84.7%, a difference of 0.0%), Maltese (84.7%, a difference of 0.020%), and Asian (84.7%, a difference of 0.020%). Similarly, the demographic groups most similar to Germans are Finnish (84.7%, a difference of 0.0%), Immigrants from South America (84.7%, a difference of 0.0%), Slavic (84.7%, a difference of 0.0%), Burmese (84.7%, a difference of 0.010%), and Immigrants from Northern Europe (84.7%, a difference of 0.010%).
| Demographics | Rating | Rank | In Labor Force | Age 35-44 |
| Immigrants | China | 92.3 /100 | #117 | Exceptional 84.7% |
| Immigrants | Eastern Asia | 92.1 /100 | #118 | Exceptional 84.7% |
| Burmese | 91.8 /100 | #119 | Exceptional 84.7% |
| Immigrants | Northern Europe | 91.5 /100 | #120 | Exceptional 84.7% |
| Finns | 91.2 /100 | #121 | Exceptional 84.7% |
| Germans | 91.0 /100 | #122 | Exceptional 84.7% |
| Immigrants | South America | 90.9 /100 | #123 | Exceptional 84.7% |
| Slavs | 90.8 /100 | #124 | Exceptional 84.7% |
| Maltese | 90.8 /100 | #125 | Exceptional 84.7% |
| Asians | 90.6 /100 | #126 | Exceptional 84.7% |
| Immigrants | Spain | 90.6 /100 | #127 | Exceptional 84.7% |
| Immigrants | Ghana | 90.4 /100 | #128 | Exceptional 84.7% |
| Palestinians | 89.7 /100 | #129 | Excellent 84.7% |
| Bhutanese | 89.7 /100 | #130 | Excellent 84.7% |
| Immigrants | Scotland | 89.6 /100 | #131 | Excellent 84.7% |
| Austrians | 89.4 /100 | #132 | Excellent 84.7% |
| Argentineans | 88.4 /100 | #133 | Excellent 84.6% |
| Immigrants | Korea | 88.2 /100 | #134 | Excellent 84.6% |
| Immigrants | Malaysia | 87.5 /100 | #135 | Excellent 84.6% |
| Afghans | 86.3 /100 | #136 | Excellent 84.6% |
| Immigrants | Chile | 84.6 /100 | #137 | Excellent 84.6% |