Guyanese vs Sioux In Labor Force | Age 45-54
COMPARE
Guyanese
Sioux
In Labor Force | Age 45-54
In Labor Force | Age 45-54 Comparison
Guyanese
Sioux
81.5%
IN LABOR FORCE | AGE 45-54
0.1/ 100
METRIC RATING
259th/ 347
METRIC RANK
78.0%
IN LABOR FORCE | AGE 45-54
0.0/ 100
METRIC RATING
328th/ 347
METRIC RANK
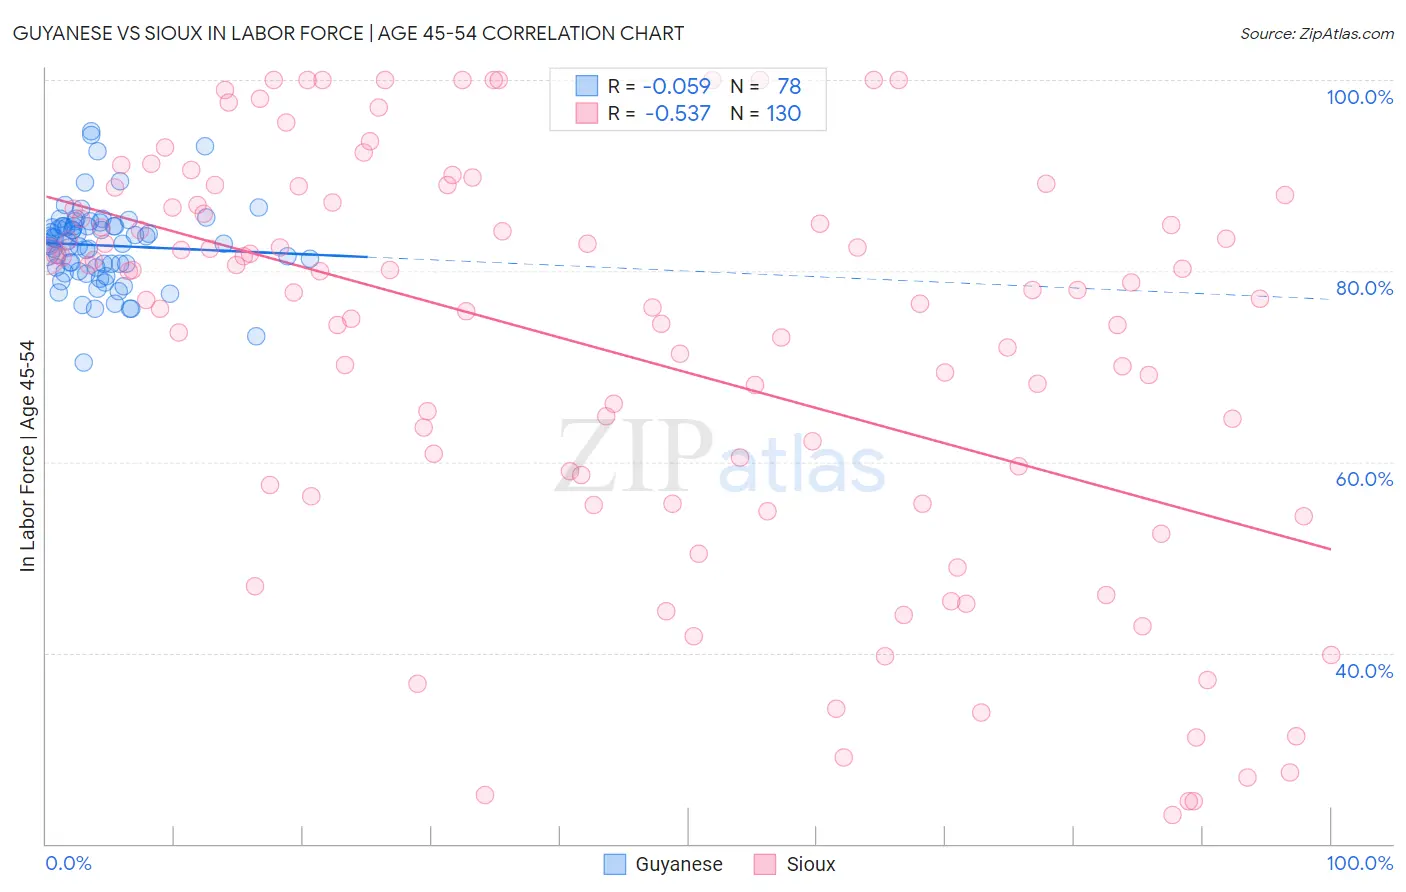
Guyanese vs Sioux In Labor Force | Age 45-54 Correlation Chart
The statistical analysis conducted on geographies consisting of 176,787,593 people shows a slight negative correlation between the proportion of Guyanese and labor force participation rate among population between the ages 45 and 54 in the United States with a correlation coefficient (R) of -0.059 and weighted average of 81.5%. Similarly, the statistical analysis conducted on geographies consisting of 234,094,321 people shows a substantial negative correlation between the proportion of Sioux and labor force participation rate among population between the ages 45 and 54 in the United States with a correlation coefficient (R) of -0.537 and weighted average of 78.0%, a difference of 4.6%.
In Labor Force | Age 45-54 Correlation Summary
| Measurement | Guyanese | Sioux |
| Minimum | 70.4% | 23.0% |
| Maximum | 94.6% | 100.0% |
| Range | 24.3% | 77.0% |
| Mean | 82.7% | 71.7% |
| Median | 82.8% | 77.9% |
| Interquartile 25% (IQ1) | 80.4% | 57.6% |
| Interquartile 75% (IQ3) | 84.7% | 86.6% |
| Interquartile Range (IQR) | 4.3% | 29.0% |
| Standard Deviation (Sample) | 4.3% | 21.0% |
| Standard Deviation (Population) | 4.2% | 21.0% |
Similar Demographics by In Labor Force | Age 45-54
Demographics Similar to Guyanese by In Labor Force | Age 45-54
In terms of in labor force | age 45-54, the demographic groups most similar to Guyanese are Immigrants from Fiji (81.5%, a difference of 0.010%), Immigrants from Congo (81.6%, a difference of 0.020%), Spaniard (81.5%, a difference of 0.030%), Barbadian (81.6%, a difference of 0.040%), and Hawaiian (81.5%, a difference of 0.040%).
| Demographics | Rating | Rank | In Labor Force | Age 45-54 |
| Pennsylvania Germans | 0.2 /100 | #252 | Tragic 81.6% |
| Japanese | 0.2 /100 | #253 | Tragic 81.6% |
| Immigrants | Laos | 0.2 /100 | #254 | Tragic 81.6% |
| Scotch-Irish | 0.2 /100 | #255 | Tragic 81.6% |
| Barbadians | 0.1 /100 | #256 | Tragic 81.6% |
| Immigrants | Congo | 0.1 /100 | #257 | Tragic 81.6% |
| Immigrants | Fiji | 0.1 /100 | #258 | Tragic 81.5% |
| Guyanese | 0.1 /100 | #259 | Tragic 81.5% |
| Spaniards | 0.1 /100 | #260 | Tragic 81.5% |
| Hawaiians | 0.1 /100 | #261 | Tragic 81.5% |
| Immigrants | Guyana | 0.1 /100 | #262 | Tragic 81.5% |
| Indonesians | 0.1 /100 | #263 | Tragic 81.5% |
| Immigrants | West Indies | 0.1 /100 | #264 | Tragic 81.5% |
| Hondurans | 0.1 /100 | #265 | Tragic 81.4% |
| Immigrants | St. Vincent and the Grenadines | 0.1 /100 | #266 | Tragic 81.4% |
Demographics Similar to Sioux by In Labor Force | Age 45-54
In terms of in labor force | age 45-54, the demographic groups most similar to Sioux are Cajun (78.1%, a difference of 0.22%), Seminole (78.1%, a difference of 0.23%), Choctaw (78.2%, a difference of 0.28%), Creek (77.7%, a difference of 0.29%), and Dutch West Indian (78.2%, a difference of 0.37%).
| Demographics | Rating | Rank | In Labor Force | Age 45-54 |
| Yup'ik | 0.0 /100 | #321 | Tragic 78.6% |
| Crow | 0.0 /100 | #322 | Tragic 78.3% |
| Kiowa | 0.0 /100 | #323 | Tragic 78.3% |
| Dutch West Indians | 0.0 /100 | #324 | Tragic 78.2% |
| Choctaw | 0.0 /100 | #325 | Tragic 78.2% |
| Seminole | 0.0 /100 | #326 | Tragic 78.1% |
| Cajuns | 0.0 /100 | #327 | Tragic 78.1% |
| Sioux | 0.0 /100 | #328 | Tragic 78.0% |
| Creek | 0.0 /100 | #329 | Tragic 77.7% |
| Cheyenne | 0.0 /100 | #330 | Tragic 77.6% |
| Tsimshian | 0.0 /100 | #331 | Tragic 77.4% |
| Menominee | 0.0 /100 | #332 | Tragic 77.4% |
| Natives/Alaskans | 0.0 /100 | #333 | Tragic 77.1% |
| Apache | 0.0 /100 | #334 | Tragic 77.1% |
| Arapaho | 0.0 /100 | #335 | Tragic 77.1% |