Guyanese vs Guatemalan In Labor Force | Age 45-54
COMPARE
Guyanese
Guatemalan
In Labor Force | Age 45-54
In Labor Force | Age 45-54 Comparison
Guyanese
Guatemalans
81.5%
IN LABOR FORCE | AGE 45-54
0.1/ 100
METRIC RATING
259th/ 347
METRIC RANK
81.2%
IN LABOR FORCE | AGE 45-54
0.0/ 100
METRIC RATING
277th/ 347
METRIC RANK
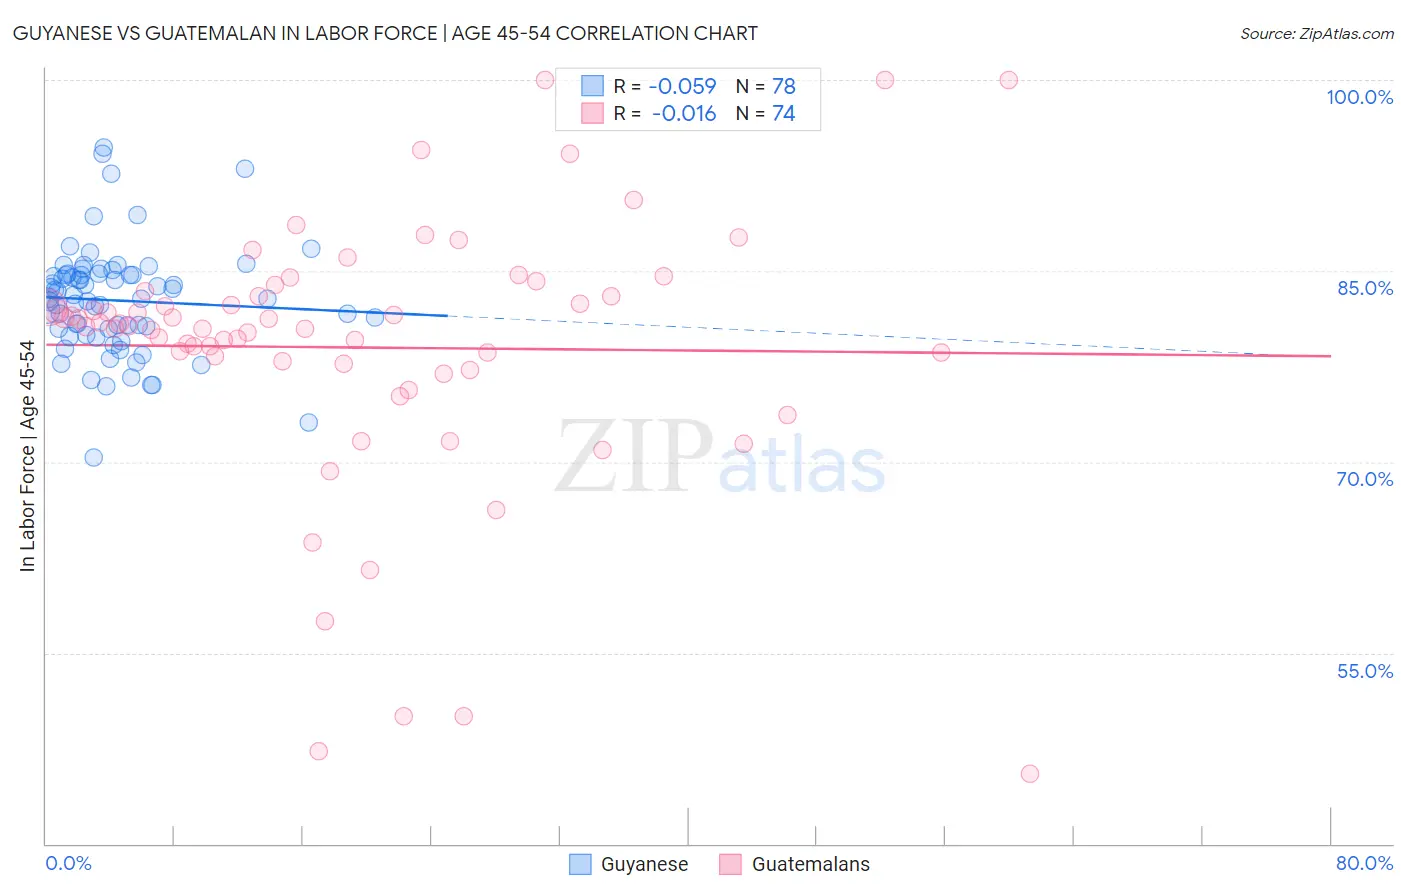
Guyanese vs Guatemalan In Labor Force | Age 45-54 Correlation Chart
The statistical analysis conducted on geographies consisting of 176,787,593 people shows a slight negative correlation between the proportion of Guyanese and labor force participation rate among population between the ages 45 and 54 in the United States with a correlation coefficient (R) of -0.059 and weighted average of 81.5%. Similarly, the statistical analysis conducted on geographies consisting of 409,275,679 people shows no correlation between the proportion of Guatemalans and labor force participation rate among population between the ages 45 and 54 in the United States with a correlation coefficient (R) of -0.016 and weighted average of 81.2%, a difference of 0.44%.
In Labor Force | Age 45-54 Correlation Summary
| Measurement | Guyanese | Guatemalan |
| Minimum | 70.4% | 45.5% |
| Maximum | 94.6% | 100.0% |
| Range | 24.3% | 54.5% |
| Mean | 82.7% | 79.0% |
| Median | 82.8% | 80.6% |
| Interquartile 25% (IQ1) | 80.4% | 77.7% |
| Interquartile 75% (IQ3) | 84.7% | 83.0% |
| Interquartile Range (IQR) | 4.3% | 5.3% |
| Standard Deviation (Sample) | 4.3% | 10.5% |
| Standard Deviation (Population) | 4.2% | 10.4% |
Demographics Similar to Guyanese and Guatemalans by In Labor Force | Age 45-54
In terms of in labor force | age 45-54, the demographic groups most similar to Guyanese are Immigrants from Fiji (81.5%, a difference of 0.010%), Spaniard (81.5%, a difference of 0.030%), Hawaiian (81.5%, a difference of 0.040%), Immigrants from Guyana (81.5%, a difference of 0.040%), and Indonesian (81.5%, a difference of 0.050%). Similarly, the demographic groups most similar to Guatemalans are U.S. Virgin Islander (81.2%, a difference of 0.020%), Nonimmigrants (81.2%, a difference of 0.060%), British West Indian (81.2%, a difference of 0.070%), Immigrants from Guatemala (81.1%, a difference of 0.080%), and Chippewa (81.3%, a difference of 0.11%).
| Demographics | Rating | Rank | In Labor Force | Age 45-54 |
| Immigrants | Fiji | 0.1 /100 | #258 | Tragic 81.5% |
| Guyanese | 0.1 /100 | #259 | Tragic 81.5% |
| Spaniards | 0.1 /100 | #260 | Tragic 81.5% |
| Hawaiians | 0.1 /100 | #261 | Tragic 81.5% |
| Immigrants | Guyana | 0.1 /100 | #262 | Tragic 81.5% |
| Indonesians | 0.1 /100 | #263 | Tragic 81.5% |
| Immigrants | West Indies | 0.1 /100 | #264 | Tragic 81.5% |
| Hondurans | 0.1 /100 | #265 | Tragic 81.4% |
| Immigrants | St. Vincent and the Grenadines | 0.1 /100 | #266 | Tragic 81.4% |
| West Indians | 0.1 /100 | #267 | Tragic 81.4% |
| Immigrants | Honduras | 0.0 /100 | #268 | Tragic 81.4% |
| Alsatians | 0.0 /100 | #269 | Tragic 81.3% |
| Bangladeshis | 0.0 /100 | #270 | Tragic 81.3% |
| Immigrants | Barbados | 0.0 /100 | #271 | Tragic 81.3% |
| Spanish | 0.0 /100 | #272 | Tragic 81.3% |
| Chippewa | 0.0 /100 | #273 | Tragic 81.3% |
| British West Indians | 0.0 /100 | #274 | Tragic 81.2% |
| Immigrants | Nonimmigrants | 0.0 /100 | #275 | Tragic 81.2% |
| U.S. Virgin Islanders | 0.0 /100 | #276 | Tragic 81.2% |
| Guatemalans | 0.0 /100 | #277 | Tragic 81.2% |
| Immigrants | Guatemala | 0.0 /100 | #278 | Tragic 81.1% |