Guyanese vs Immigrants from North Macedonia In Labor Force | Age 45-54
COMPARE
Guyanese
Immigrants from North Macedonia
In Labor Force | Age 45-54
In Labor Force | Age 45-54 Comparison
Guyanese
Immigrants from North Macedonia
81.5%
IN LABOR FORCE | AGE 45-54
0.1/ 100
METRIC RATING
259th/ 347
METRIC RANK
83.9%
IN LABOR FORCE | AGE 45-54
99.8/ 100
METRIC RATING
25th/ 347
METRIC RANK
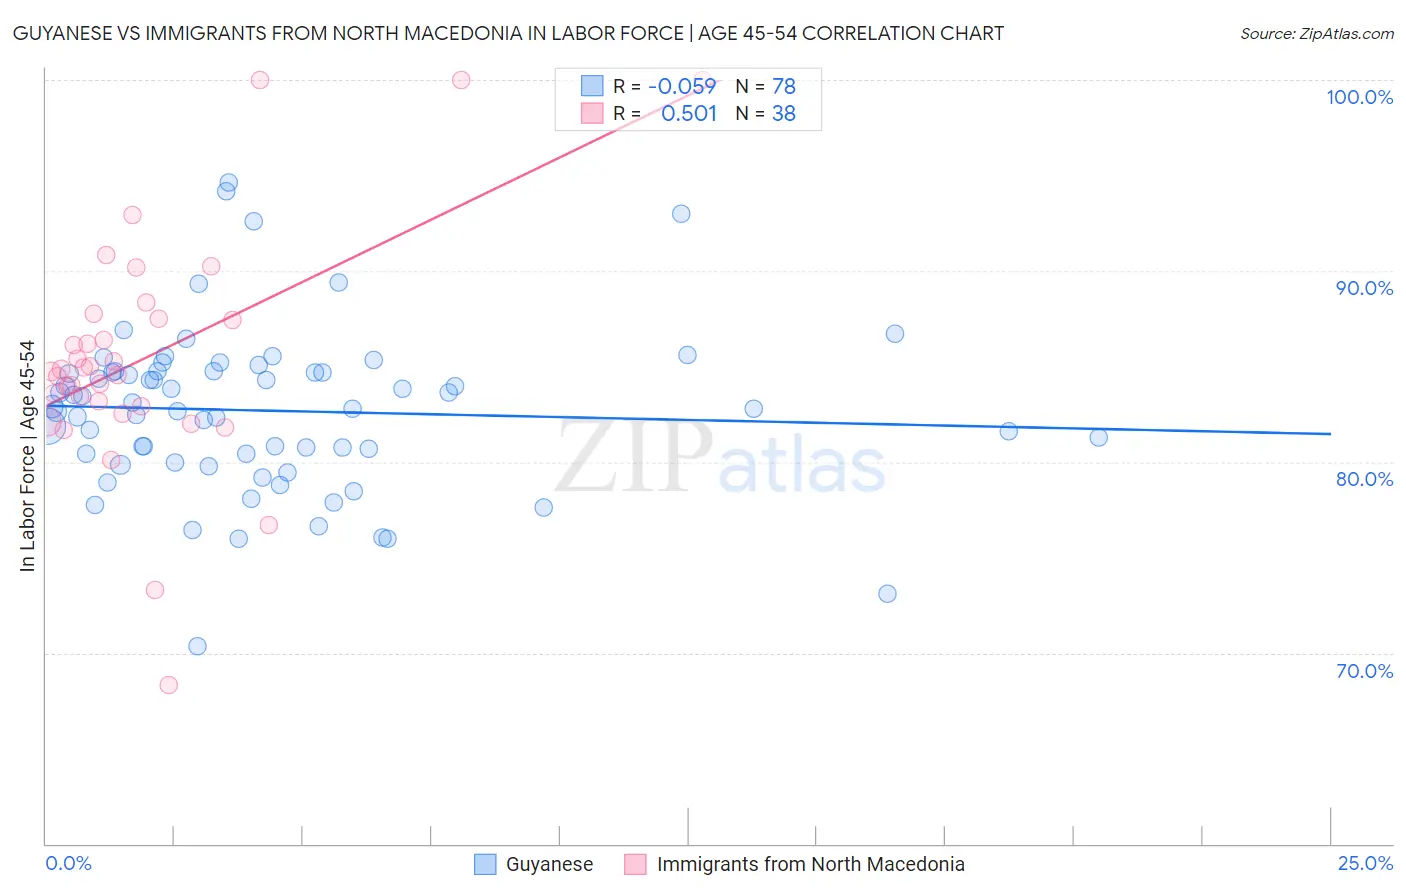
Guyanese vs Immigrants from North Macedonia In Labor Force | Age 45-54 Correlation Chart
The statistical analysis conducted on geographies consisting of 176,787,593 people shows a slight negative correlation between the proportion of Guyanese and labor force participation rate among population between the ages 45 and 54 in the United States with a correlation coefficient (R) of -0.059 and weighted average of 81.5%. Similarly, the statistical analysis conducted on geographies consisting of 74,300,796 people shows a substantial positive correlation between the proportion of Immigrants from North Macedonia and labor force participation rate among population between the ages 45 and 54 in the United States with a correlation coefficient (R) of 0.501 and weighted average of 83.9%, a difference of 2.9%.
In Labor Force | Age 45-54 Correlation Summary
| Measurement | Guyanese | Immigrants from North Macedonia |
| Minimum | 70.4% | 68.3% |
| Maximum | 94.6% | 100.0% |
| Range | 24.3% | 31.7% |
| Mean | 82.7% | 85.4% |
| Median | 82.8% | 84.8% |
| Interquartile 25% (IQ1) | 80.4% | 82.9% |
| Interquartile 75% (IQ3) | 84.7% | 87.5% |
| Interquartile Range (IQR) | 4.3% | 4.6% |
| Standard Deviation (Sample) | 4.3% | 6.2% |
| Standard Deviation (Population) | 4.2% | 6.1% |
Similar Demographics by In Labor Force | Age 45-54
Demographics Similar to Guyanese by In Labor Force | Age 45-54
In terms of in labor force | age 45-54, the demographic groups most similar to Guyanese are Immigrants from Fiji (81.5%, a difference of 0.010%), Immigrants from Congo (81.6%, a difference of 0.020%), Spaniard (81.5%, a difference of 0.030%), Barbadian (81.6%, a difference of 0.040%), and Hawaiian (81.5%, a difference of 0.040%).
| Demographics | Rating | Rank | In Labor Force | Age 45-54 |
| Pennsylvania Germans | 0.2 /100 | #252 | Tragic 81.6% |
| Japanese | 0.2 /100 | #253 | Tragic 81.6% |
| Immigrants | Laos | 0.2 /100 | #254 | Tragic 81.6% |
| Scotch-Irish | 0.2 /100 | #255 | Tragic 81.6% |
| Barbadians | 0.1 /100 | #256 | Tragic 81.6% |
| Immigrants | Congo | 0.1 /100 | #257 | Tragic 81.6% |
| Immigrants | Fiji | 0.1 /100 | #258 | Tragic 81.5% |
| Guyanese | 0.1 /100 | #259 | Tragic 81.5% |
| Spaniards | 0.1 /100 | #260 | Tragic 81.5% |
| Hawaiians | 0.1 /100 | #261 | Tragic 81.5% |
| Immigrants | Guyana | 0.1 /100 | #262 | Tragic 81.5% |
| Indonesians | 0.1 /100 | #263 | Tragic 81.5% |
| Immigrants | West Indies | 0.1 /100 | #264 | Tragic 81.5% |
| Hondurans | 0.1 /100 | #265 | Tragic 81.4% |
| Immigrants | St. Vincent and the Grenadines | 0.1 /100 | #266 | Tragic 81.4% |
Demographics Similar to Immigrants from North Macedonia by In Labor Force | Age 45-54
In terms of in labor force | age 45-54, the demographic groups most similar to Immigrants from North Macedonia are Immigrants from Serbia (83.9%, a difference of 0.010%), Immigrants from Brazil (83.9%, a difference of 0.020%), Slovene (83.9%, a difference of 0.030%), Immigrants from Lithuania (83.9%, a difference of 0.030%), and Immigrants from Eastern Africa (83.9%, a difference of 0.040%).
| Demographics | Rating | Rank | In Labor Force | Age 45-54 |
| Immigrants | South Central Asia | 99.9 /100 | #18 | Exceptional 84.0% |
| Czechs | 99.8 /100 | #19 | Exceptional 83.9% |
| Immigrants | Eastern Africa | 99.8 /100 | #20 | Exceptional 83.9% |
| Immigrants | Sri Lanka | 99.8 /100 | #21 | Exceptional 83.9% |
| Immigrants | Ireland | 99.8 /100 | #22 | Exceptional 83.9% |
| Tlingit-Haida | 99.8 /100 | #23 | Exceptional 83.9% |
| Slovenes | 99.8 /100 | #24 | Exceptional 83.9% |
| Immigrants | North Macedonia | 99.8 /100 | #25 | Exceptional 83.9% |
| Immigrants | Serbia | 99.8 /100 | #26 | Exceptional 83.9% |
| Immigrants | Brazil | 99.8 /100 | #27 | Exceptional 83.9% |
| Immigrants | Lithuania | 99.8 /100 | #28 | Exceptional 83.9% |
| Immigrants | Pakistan | 99.7 /100 | #29 | Exceptional 83.8% |
| Immigrants | Bulgaria | 99.7 /100 | #30 | Exceptional 83.8% |
| Immigrants | Eritrea | 99.7 /100 | #31 | Exceptional 83.8% |
| Turks | 99.7 /100 | #32 | Exceptional 83.8% |