Guyanese vs Irish In Labor Force | Age 45-54
COMPARE
Guyanese
Irish
In Labor Force | Age 45-54
In Labor Force | Age 45-54 Comparison
Guyanese
Irish
81.5%
IN LABOR FORCE | AGE 45-54
0.1/ 100
METRIC RATING
259th/ 347
METRIC RANK
82.6%
IN LABOR FORCE | AGE 45-54
29.2/ 100
METRIC RATING
186th/ 347
METRIC RANK
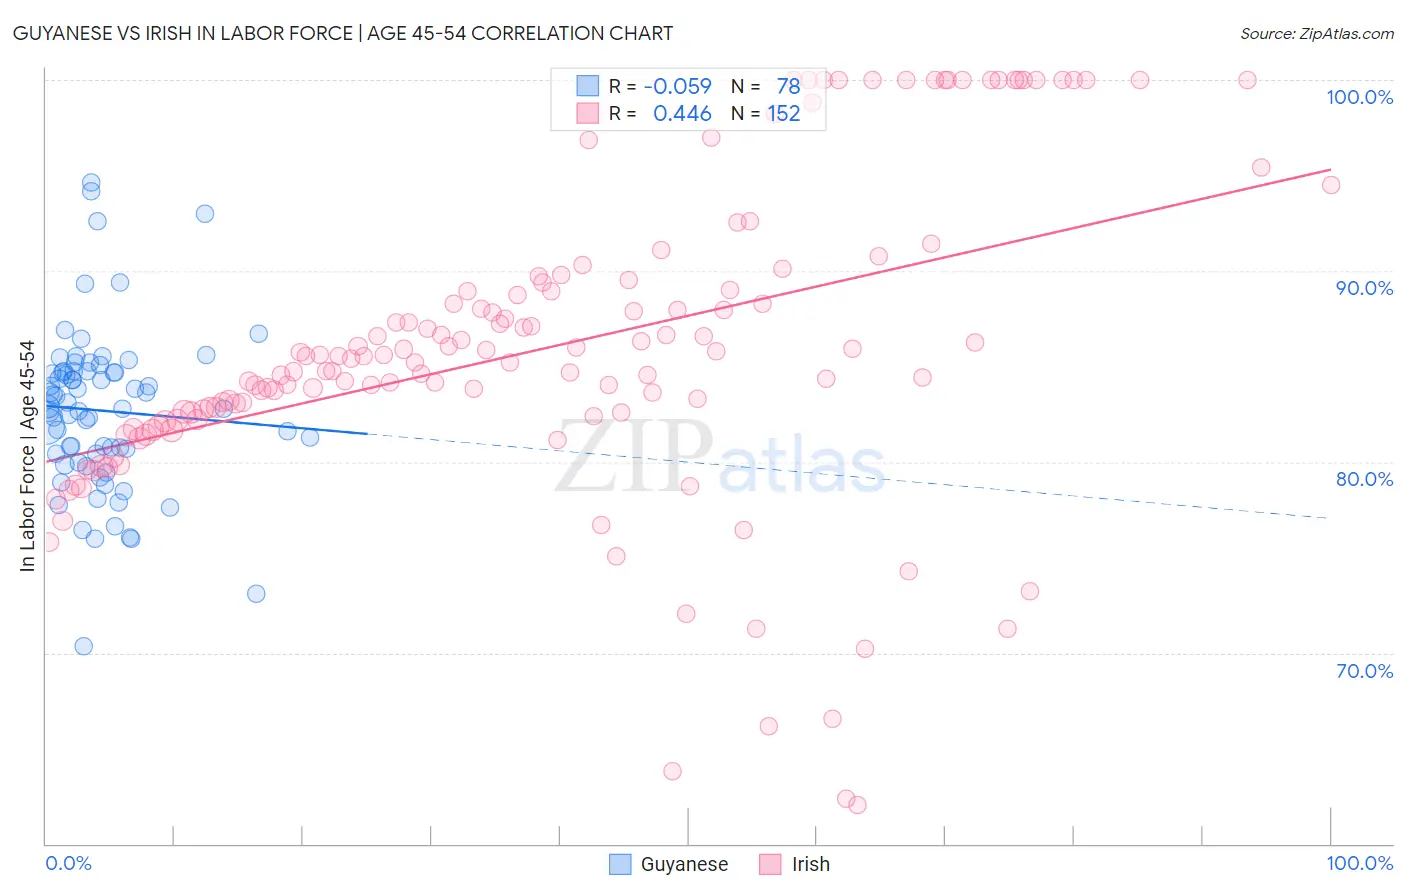
Guyanese vs Irish In Labor Force | Age 45-54 Correlation Chart
The statistical analysis conducted on geographies consisting of 176,787,593 people shows a slight negative correlation between the proportion of Guyanese and labor force participation rate among population between the ages 45 and 54 in the United States with a correlation coefficient (R) of -0.059 and weighted average of 81.5%. Similarly, the statistical analysis conducted on geographies consisting of 579,633,404 people shows a moderate positive correlation between the proportion of Irish and labor force participation rate among population between the ages 45 and 54 in the United States with a correlation coefficient (R) of 0.446 and weighted average of 82.6%, a difference of 1.3%.
In Labor Force | Age 45-54 Correlation Summary
| Measurement | Guyanese | Irish |
| Minimum | 70.4% | 62.0% |
| Maximum | 94.6% | 100.0% |
| Range | 24.3% | 38.0% |
| Mean | 82.7% | 86.0% |
| Median | 82.8% | 85.5% |
| Interquartile 25% (IQ1) | 80.4% | 82.3% |
| Interquartile 75% (IQ3) | 84.7% | 89.2% |
| Interquartile Range (IQR) | 4.3% | 6.9% |
| Standard Deviation (Sample) | 4.3% | 8.2% |
| Standard Deviation (Population) | 4.2% | 8.2% |
Similar Demographics by In Labor Force | Age 45-54
Demographics Similar to Guyanese by In Labor Force | Age 45-54
In terms of in labor force | age 45-54, the demographic groups most similar to Guyanese are Immigrants from Fiji (81.5%, a difference of 0.010%), Immigrants from Congo (81.6%, a difference of 0.020%), Spaniard (81.5%, a difference of 0.030%), Barbadian (81.6%, a difference of 0.040%), and Hawaiian (81.5%, a difference of 0.040%).
| Demographics | Rating | Rank | In Labor Force | Age 45-54 |
| Pennsylvania Germans | 0.2 /100 | #252 | Tragic 81.6% |
| Japanese | 0.2 /100 | #253 | Tragic 81.6% |
| Immigrants | Laos | 0.2 /100 | #254 | Tragic 81.6% |
| Scotch-Irish | 0.2 /100 | #255 | Tragic 81.6% |
| Barbadians | 0.1 /100 | #256 | Tragic 81.6% |
| Immigrants | Congo | 0.1 /100 | #257 | Tragic 81.6% |
| Immigrants | Fiji | 0.1 /100 | #258 | Tragic 81.5% |
| Guyanese | 0.1 /100 | #259 | Tragic 81.5% |
| Spaniards | 0.1 /100 | #260 | Tragic 81.5% |
| Hawaiians | 0.1 /100 | #261 | Tragic 81.5% |
| Immigrants | Guyana | 0.1 /100 | #262 | Tragic 81.5% |
| Indonesians | 0.1 /100 | #263 | Tragic 81.5% |
| Immigrants | West Indies | 0.1 /100 | #264 | Tragic 81.5% |
| Hondurans | 0.1 /100 | #265 | Tragic 81.4% |
| Immigrants | St. Vincent and the Grenadines | 0.1 /100 | #266 | Tragic 81.4% |
Demographics Similar to Irish by In Labor Force | Age 45-54
In terms of in labor force | age 45-54, the demographic groups most similar to Irish are Immigrants from Costa Rica (82.6%, a difference of 0.010%), South African (82.6%, a difference of 0.010%), Immigrants from England (82.6%, a difference of 0.030%), Syrian (82.6%, a difference of 0.030%), and New Zealander (82.6%, a difference of 0.040%).
| Demographics | Rating | Rank | In Labor Force | Age 45-54 |
| Immigrants | Switzerland | 39.4 /100 | #179 | Fair 82.7% |
| Hungarians | 38.0 /100 | #180 | Fair 82.7% |
| Israelis | 37.7 /100 | #181 | Fair 82.7% |
| Immigrants | Hungary | 37.1 /100 | #182 | Fair 82.7% |
| New Zealanders | 32.7 /100 | #183 | Fair 82.6% |
| Europeans | 32.6 /100 | #184 | Fair 82.6% |
| Immigrants | England | 32.2 /100 | #185 | Fair 82.6% |
| Irish | 29.2 /100 | #186 | Fair 82.6% |
| Immigrants | Costa Rica | 28.3 /100 | #187 | Fair 82.6% |
| South Africans | 28.0 /100 | #188 | Fair 82.6% |
| Syrians | 26.0 /100 | #189 | Fair 82.6% |
| British | 25.7 /100 | #190 | Fair 82.6% |
| Armenians | 23.2 /100 | #191 | Fair 82.5% |
| Immigrants | Iraq | 20.9 /100 | #192 | Fair 82.5% |
| Australians | 20.8 /100 | #193 | Fair 82.5% |