Italian vs Sioux In Labor Force | Age 45-54
COMPARE
Italian
Sioux
In Labor Force | Age 45-54
In Labor Force | Age 45-54 Comparison
Italians
Sioux
83.3%
IN LABOR FORCE | AGE 45-54
95.1/ 100
METRIC RATING
93rd/ 347
METRIC RANK
78.0%
IN LABOR FORCE | AGE 45-54
0.0/ 100
METRIC RATING
328th/ 347
METRIC RANK
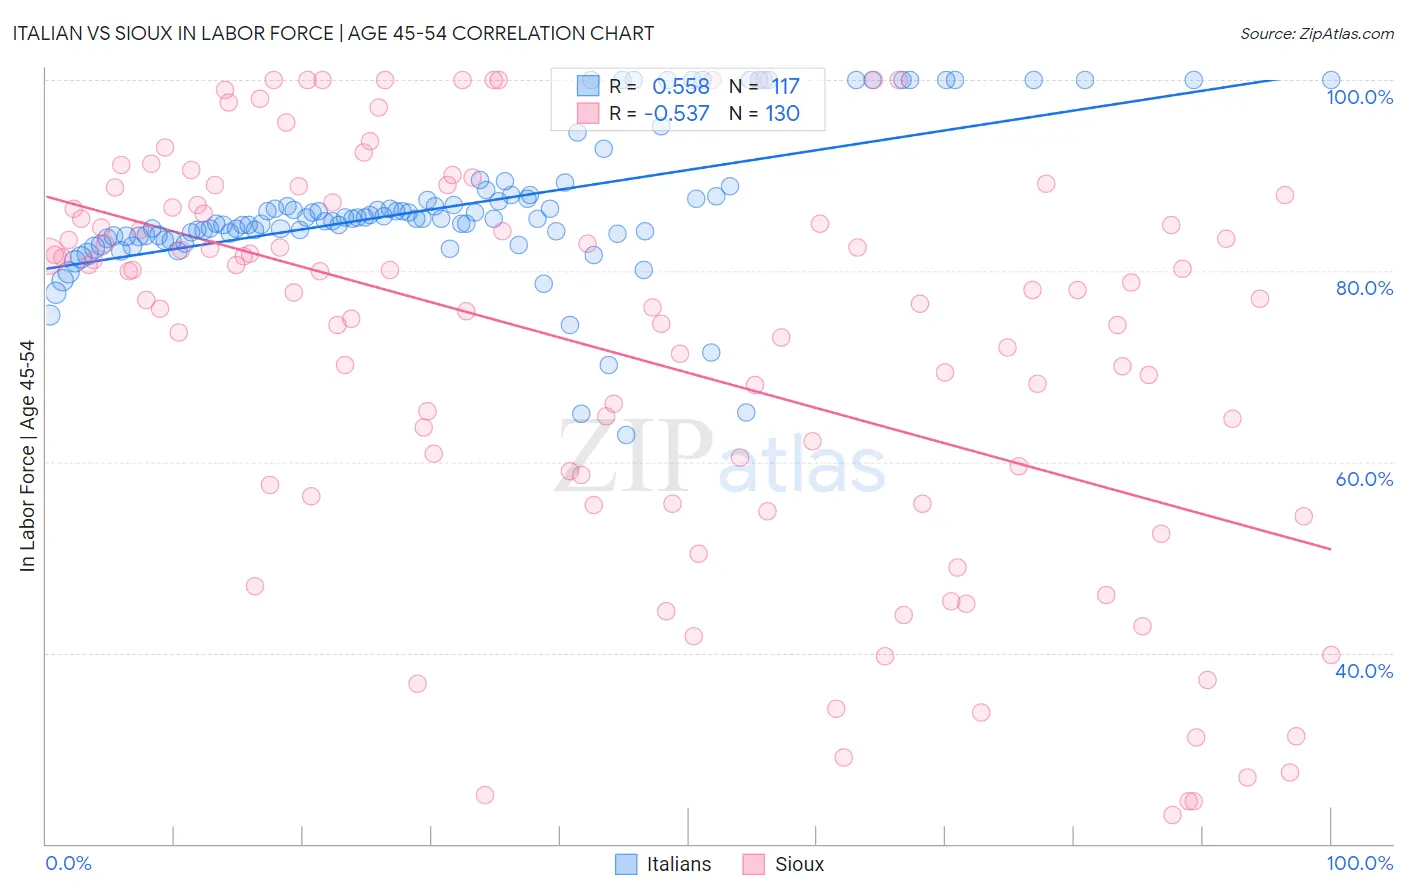
Italian vs Sioux In Labor Force | Age 45-54 Correlation Chart
The statistical analysis conducted on geographies consisting of 574,249,528 people shows a substantial positive correlation between the proportion of Italians and labor force participation rate among population between the ages 45 and 54 in the United States with a correlation coefficient (R) of 0.558 and weighted average of 83.3%. Similarly, the statistical analysis conducted on geographies consisting of 234,094,321 people shows a substantial negative correlation between the proportion of Sioux and labor force participation rate among population between the ages 45 and 54 in the United States with a correlation coefficient (R) of -0.537 and weighted average of 78.0%, a difference of 6.9%.
In Labor Force | Age 45-54 Correlation Summary
| Measurement | Italian | Sioux |
| Minimum | 62.8% | 23.0% |
| Maximum | 100.0% | 100.0% |
| Range | 37.2% | 77.0% |
| Mean | 86.7% | 71.7% |
| Median | 85.4% | 77.9% |
| Interquartile 25% (IQ1) | 83.6% | 57.6% |
| Interquartile 75% (IQ3) | 87.9% | 86.6% |
| Interquartile Range (IQR) | 4.3% | 29.0% |
| Standard Deviation (Sample) | 7.7% | 21.0% |
| Standard Deviation (Population) | 7.6% | 21.0% |
Similar Demographics by In Labor Force | Age 45-54
Demographics Similar to Italians by In Labor Force | Age 45-54
In terms of in labor force | age 45-54, the demographic groups most similar to Italians are Danish (83.3%, a difference of 0.010%), Argentinean (83.3%, a difference of 0.010%), Immigrants from Argentina (83.3%, a difference of 0.010%), Immigrants from Eastern Europe (83.3%, a difference of 0.020%), and Immigrants from Asia (83.3%, a difference of 0.020%).
| Demographics | Rating | Rank | In Labor Force | Age 45-54 |
| Immigrants | Northern Africa | 95.7 /100 | #86 | Exceptional 83.3% |
| Immigrants | Eastern Europe | 95.6 /100 | #87 | Exceptional 83.3% |
| Immigrants | Asia | 95.6 /100 | #88 | Exceptional 83.3% |
| Indians (Asian) | 95.5 /100 | #89 | Exceptional 83.3% |
| Immigrants | Japan | 95.5 /100 | #90 | Exceptional 83.3% |
| South Americans | 95.5 /100 | #91 | Exceptional 83.3% |
| Danes | 95.3 /100 | #92 | Exceptional 83.3% |
| Italians | 95.1 /100 | #93 | Exceptional 83.3% |
| Argentineans | 94.9 /100 | #94 | Exceptional 83.3% |
| Immigrants | Argentina | 94.9 /100 | #95 | Exceptional 83.3% |
| Immigrants | Kuwait | 94.8 /100 | #96 | Exceptional 83.3% |
| Palestinians | 94.8 /100 | #97 | Exceptional 83.3% |
| Maltese | 94.4 /100 | #98 | Exceptional 83.3% |
| Immigrants | Middle Africa | 94.3 /100 | #99 | Exceptional 83.3% |
| Mongolians | 94.2 /100 | #100 | Exceptional 83.3% |
Demographics Similar to Sioux by In Labor Force | Age 45-54
In terms of in labor force | age 45-54, the demographic groups most similar to Sioux are Cajun (78.1%, a difference of 0.22%), Seminole (78.1%, a difference of 0.23%), Choctaw (78.2%, a difference of 0.28%), Creek (77.7%, a difference of 0.29%), and Dutch West Indian (78.2%, a difference of 0.37%).
| Demographics | Rating | Rank | In Labor Force | Age 45-54 |
| Yup'ik | 0.0 /100 | #321 | Tragic 78.6% |
| Crow | 0.0 /100 | #322 | Tragic 78.3% |
| Kiowa | 0.0 /100 | #323 | Tragic 78.3% |
| Dutch West Indians | 0.0 /100 | #324 | Tragic 78.2% |
| Choctaw | 0.0 /100 | #325 | Tragic 78.2% |
| Seminole | 0.0 /100 | #326 | Tragic 78.1% |
| Cajuns | 0.0 /100 | #327 | Tragic 78.1% |
| Sioux | 0.0 /100 | #328 | Tragic 78.0% |
| Creek | 0.0 /100 | #329 | Tragic 77.7% |
| Cheyenne | 0.0 /100 | #330 | Tragic 77.6% |
| Tsimshian | 0.0 /100 | #331 | Tragic 77.4% |
| Menominee | 0.0 /100 | #332 | Tragic 77.4% |
| Natives/Alaskans | 0.0 /100 | #333 | Tragic 77.1% |
| Apache | 0.0 /100 | #334 | Tragic 77.1% |
| Arapaho | 0.0 /100 | #335 | Tragic 77.1% |