French American Indian vs Sioux In Labor Force | Age 45-54
COMPARE
French American Indian
Sioux
In Labor Force | Age 45-54
In Labor Force | Age 45-54 Comparison
French American Indians
Sioux
80.8%
IN LABOR FORCE | AGE 45-54
0.0/ 100
METRIC RATING
283rd/ 347
METRIC RANK
78.0%
IN LABOR FORCE | AGE 45-54
0.0/ 100
METRIC RATING
328th/ 347
METRIC RANK
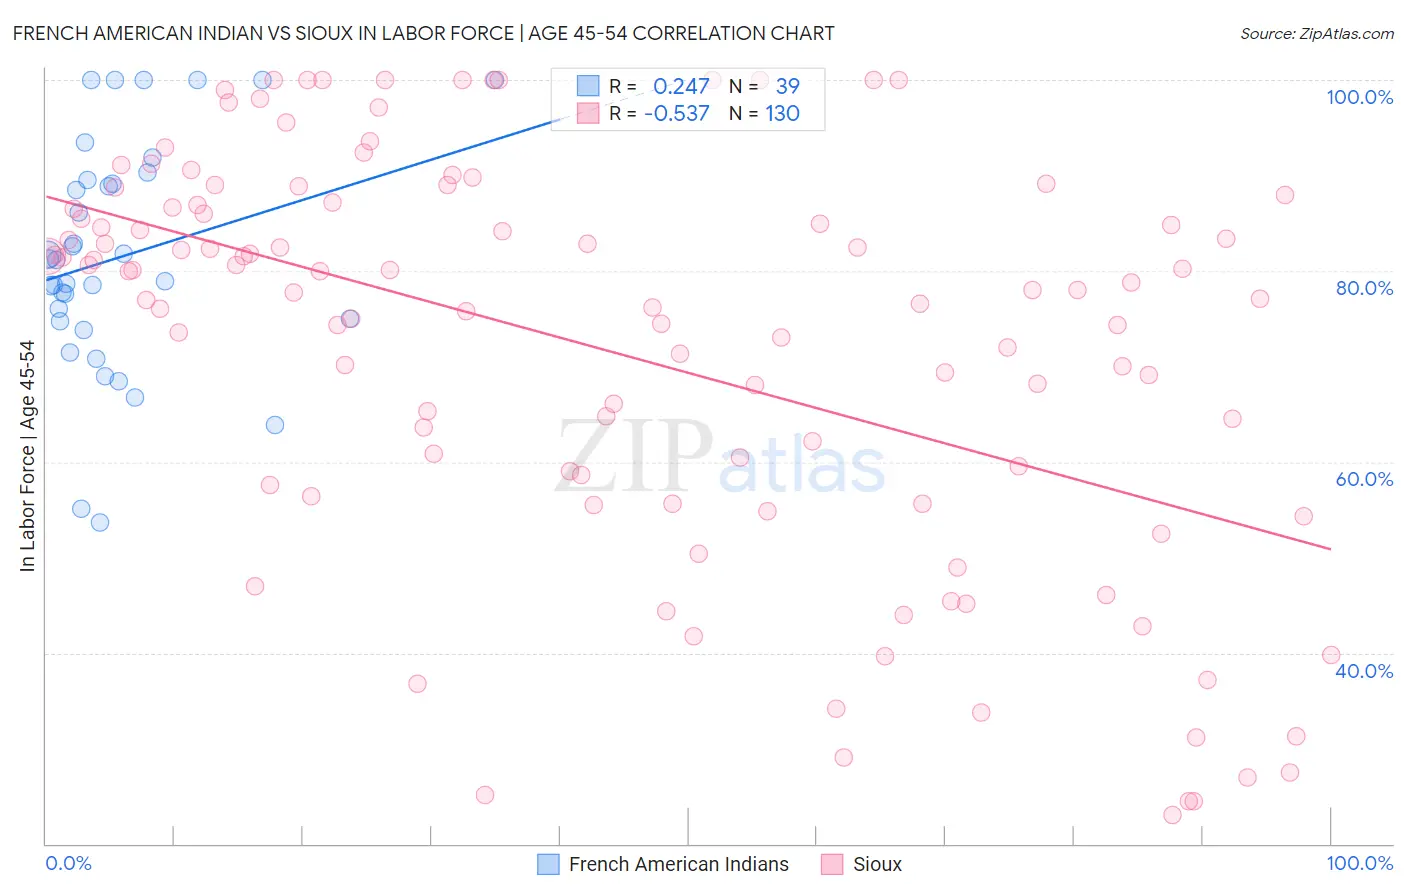
French American Indian vs Sioux In Labor Force | Age 45-54 Correlation Chart
The statistical analysis conducted on geographies consisting of 131,958,652 people shows a weak positive correlation between the proportion of French American Indians and labor force participation rate among population between the ages 45 and 54 in the United States with a correlation coefficient (R) of 0.247 and weighted average of 80.8%. Similarly, the statistical analysis conducted on geographies consisting of 234,094,321 people shows a substantial negative correlation between the proportion of Sioux and labor force participation rate among population between the ages 45 and 54 in the United States with a correlation coefficient (R) of -0.537 and weighted average of 78.0%, a difference of 3.7%.
In Labor Force | Age 45-54 Correlation Summary
| Measurement | French American Indian | Sioux |
| Minimum | 53.6% | 23.0% |
| Maximum | 100.0% | 100.0% |
| Range | 46.4% | 77.0% |
| Mean | 81.4% | 71.7% |
| Median | 81.1% | 77.9% |
| Interquartile 25% (IQ1) | 74.7% | 57.6% |
| Interquartile 75% (IQ3) | 89.5% | 86.6% |
| Interquartile Range (IQR) | 14.8% | 29.0% |
| Standard Deviation (Sample) | 11.9% | 21.0% |
| Standard Deviation (Population) | 11.8% | 21.0% |
Similar Demographics by In Labor Force | Age 45-54
Demographics Similar to French American Indians by In Labor Force | Age 45-54
In terms of in labor force | age 45-54, the demographic groups most similar to French American Indians are Belizean (80.8%, a difference of 0.050%), Delaware (80.8%, a difference of 0.060%), Immigrants from Dominica (80.8%, a difference of 0.060%), Vietnamese (80.8%, a difference of 0.070%), and Cree (80.8%, a difference of 0.070%).
| Demographics | Rating | Rank | In Labor Force | Age 45-54 |
| U.S. Virgin Islanders | 0.0 /100 | #276 | Tragic 81.2% |
| Guatemalans | 0.0 /100 | #277 | Tragic 81.2% |
| Immigrants | Guatemala | 0.0 /100 | #278 | Tragic 81.1% |
| Immigrants | Micronesia | 0.0 /100 | #279 | Tragic 81.1% |
| Immigrants | Latin America | 0.0 /100 | #280 | Tragic 81.0% |
| Immigrants | Grenada | 0.0 /100 | #281 | Tragic 81.0% |
| Aleuts | 0.0 /100 | #282 | Tragic 81.0% |
| French American Indians | 0.0 /100 | #283 | Tragic 80.8% |
| Belizeans | 0.0 /100 | #284 | Tragic 80.8% |
| Delaware | 0.0 /100 | #285 | Tragic 80.8% |
| Immigrants | Dominica | 0.0 /100 | #286 | Tragic 80.8% |
| Vietnamese | 0.0 /100 | #287 | Tragic 80.8% |
| Cree | 0.0 /100 | #288 | Tragic 80.8% |
| Immigrants | Bangladesh | 0.0 /100 | #289 | Tragic 80.7% |
| Mexican American Indians | 0.0 /100 | #290 | Tragic 80.7% |
Demographics Similar to Sioux by In Labor Force | Age 45-54
In terms of in labor force | age 45-54, the demographic groups most similar to Sioux are Cajun (78.1%, a difference of 0.22%), Seminole (78.1%, a difference of 0.23%), Choctaw (78.2%, a difference of 0.28%), Creek (77.7%, a difference of 0.29%), and Dutch West Indian (78.2%, a difference of 0.37%).
| Demographics | Rating | Rank | In Labor Force | Age 45-54 |
| Yup'ik | 0.0 /100 | #321 | Tragic 78.6% |
| Crow | 0.0 /100 | #322 | Tragic 78.3% |
| Kiowa | 0.0 /100 | #323 | Tragic 78.3% |
| Dutch West Indians | 0.0 /100 | #324 | Tragic 78.2% |
| Choctaw | 0.0 /100 | #325 | Tragic 78.2% |
| Seminole | 0.0 /100 | #326 | Tragic 78.1% |
| Cajuns | 0.0 /100 | #327 | Tragic 78.1% |
| Sioux | 0.0 /100 | #328 | Tragic 78.0% |
| Creek | 0.0 /100 | #329 | Tragic 77.7% |
| Cheyenne | 0.0 /100 | #330 | Tragic 77.6% |
| Tsimshian | 0.0 /100 | #331 | Tragic 77.4% |
| Menominee | 0.0 /100 | #332 | Tragic 77.4% |
| Natives/Alaskans | 0.0 /100 | #333 | Tragic 77.1% |
| Apache | 0.0 /100 | #334 | Tragic 77.1% |
| Arapaho | 0.0 /100 | #335 | Tragic 77.1% |