Guyanese vs Immigrants from Afghanistan In Labor Force | Age 45-54
COMPARE
Guyanese
Immigrants from Afghanistan
In Labor Force | Age 45-54
In Labor Force | Age 45-54 Comparison
Guyanese
Immigrants from Afghanistan
81.5%
IN LABOR FORCE | AGE 45-54
0.1/ 100
METRIC RATING
259th/ 347
METRIC RANK
83.2%
IN LABOR FORCE | AGE 45-54
92.4/ 100
METRIC RATING
112th/ 347
METRIC RANK
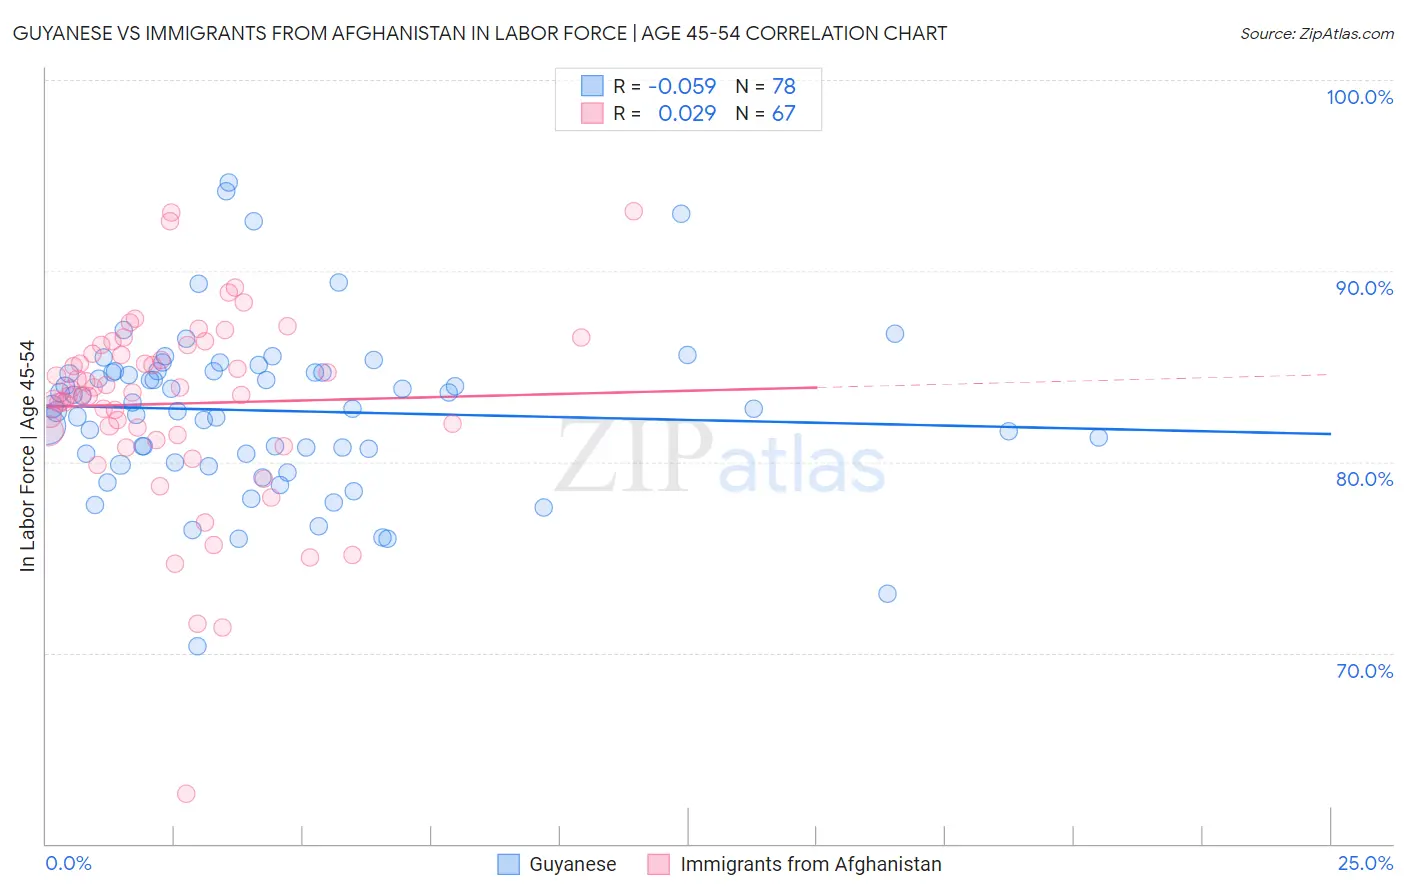
Guyanese vs Immigrants from Afghanistan In Labor Force | Age 45-54 Correlation Chart
The statistical analysis conducted on geographies consisting of 176,787,593 people shows a slight negative correlation between the proportion of Guyanese and labor force participation rate among population between the ages 45 and 54 in the United States with a correlation coefficient (R) of -0.059 and weighted average of 81.5%. Similarly, the statistical analysis conducted on geographies consisting of 147,633,155 people shows no correlation between the proportion of Immigrants from Afghanistan and labor force participation rate among population between the ages 45 and 54 in the United States with a correlation coefficient (R) of 0.029 and weighted average of 83.2%, a difference of 2.1%.
In Labor Force | Age 45-54 Correlation Summary
| Measurement | Guyanese | Immigrants from Afghanistan |
| Minimum | 70.4% | 62.6% |
| Maximum | 94.6% | 93.1% |
| Range | 24.3% | 30.5% |
| Mean | 82.7% | 83.0% |
| Median | 82.8% | 83.6% |
| Interquartile 25% (IQ1) | 80.4% | 81.4% |
| Interquartile 75% (IQ3) | 84.7% | 86.1% |
| Interquartile Range (IQR) | 4.3% | 4.7% |
| Standard Deviation (Sample) | 4.3% | 5.0% |
| Standard Deviation (Population) | 4.2% | 5.0% |
Similar Demographics by In Labor Force | Age 45-54
Demographics Similar to Guyanese by In Labor Force | Age 45-54
In terms of in labor force | age 45-54, the demographic groups most similar to Guyanese are Immigrants from Fiji (81.5%, a difference of 0.010%), Immigrants from Congo (81.6%, a difference of 0.020%), Spaniard (81.5%, a difference of 0.030%), Barbadian (81.6%, a difference of 0.040%), and Hawaiian (81.5%, a difference of 0.040%).
| Demographics | Rating | Rank | In Labor Force | Age 45-54 |
| Pennsylvania Germans | 0.2 /100 | #252 | Tragic 81.6% |
| Japanese | 0.2 /100 | #253 | Tragic 81.6% |
| Immigrants | Laos | 0.2 /100 | #254 | Tragic 81.6% |
| Scotch-Irish | 0.2 /100 | #255 | Tragic 81.6% |
| Barbadians | 0.1 /100 | #256 | Tragic 81.6% |
| Immigrants | Congo | 0.1 /100 | #257 | Tragic 81.6% |
| Immigrants | Fiji | 0.1 /100 | #258 | Tragic 81.5% |
| Guyanese | 0.1 /100 | #259 | Tragic 81.5% |
| Spaniards | 0.1 /100 | #260 | Tragic 81.5% |
| Hawaiians | 0.1 /100 | #261 | Tragic 81.5% |
| Immigrants | Guyana | 0.1 /100 | #262 | Tragic 81.5% |
| Indonesians | 0.1 /100 | #263 | Tragic 81.5% |
| Immigrants | West Indies | 0.1 /100 | #264 | Tragic 81.5% |
| Hondurans | 0.1 /100 | #265 | Tragic 81.4% |
| Immigrants | St. Vincent and the Grenadines | 0.1 /100 | #266 | Tragic 81.4% |
Demographics Similar to Immigrants from Afghanistan by In Labor Force | Age 45-54
In terms of in labor force | age 45-54, the demographic groups most similar to Immigrants from Afghanistan are Immigrants from Italy (83.2%, a difference of 0.0%), Slovak (83.2%, a difference of 0.010%), Ukrainian (83.2%, a difference of 0.010%), Immigrants from Africa (83.2%, a difference of 0.010%), and Iranian (83.2%, a difference of 0.020%).
| Demographics | Rating | Rank | In Labor Force | Age 45-54 |
| Immigrants | South America | 93.5 /100 | #105 | Exceptional 83.2% |
| Sri Lankans | 93.2 /100 | #106 | Exceptional 83.2% |
| Iranians | 92.9 /100 | #107 | Exceptional 83.2% |
| Slovaks | 92.8 /100 | #108 | Exceptional 83.2% |
| Ukrainians | 92.7 /100 | #109 | Exceptional 83.2% |
| Immigrants | Africa | 92.6 /100 | #110 | Exceptional 83.2% |
| Immigrants | Italy | 92.5 /100 | #111 | Exceptional 83.2% |
| Immigrants | Afghanistan | 92.4 /100 | #112 | Exceptional 83.2% |
| Immigrants | Albania | 91.8 /100 | #113 | Exceptional 83.2% |
| Assyrians/Chaldeans/Syriacs | 91.7 /100 | #114 | Exceptional 83.2% |
| Immigrants | Chile | 91.6 /100 | #115 | Exceptional 83.2% |
| Immigrants | Malaysia | 91.4 /100 | #116 | Exceptional 83.2% |
| Immigrants | China | 90.9 /100 | #117 | Exceptional 83.2% |
| Immigrants | Europe | 90.7 /100 | #118 | Exceptional 83.2% |
| Immigrants | Uruguay | 90.2 /100 | #119 | Exceptional 83.2% |