Guyanese vs Lumbee In Labor Force | Age 45-54
COMPARE
Guyanese
Lumbee
In Labor Force | Age 45-54
In Labor Force | Age 45-54 Comparison
Guyanese
Lumbee
81.5%
IN LABOR FORCE | AGE 45-54
0.1/ 100
METRIC RATING
259th/ 347
METRIC RANK
75.6%
IN LABOR FORCE | AGE 45-54
0.0/ 100
METRIC RATING
340th/ 347
METRIC RANK
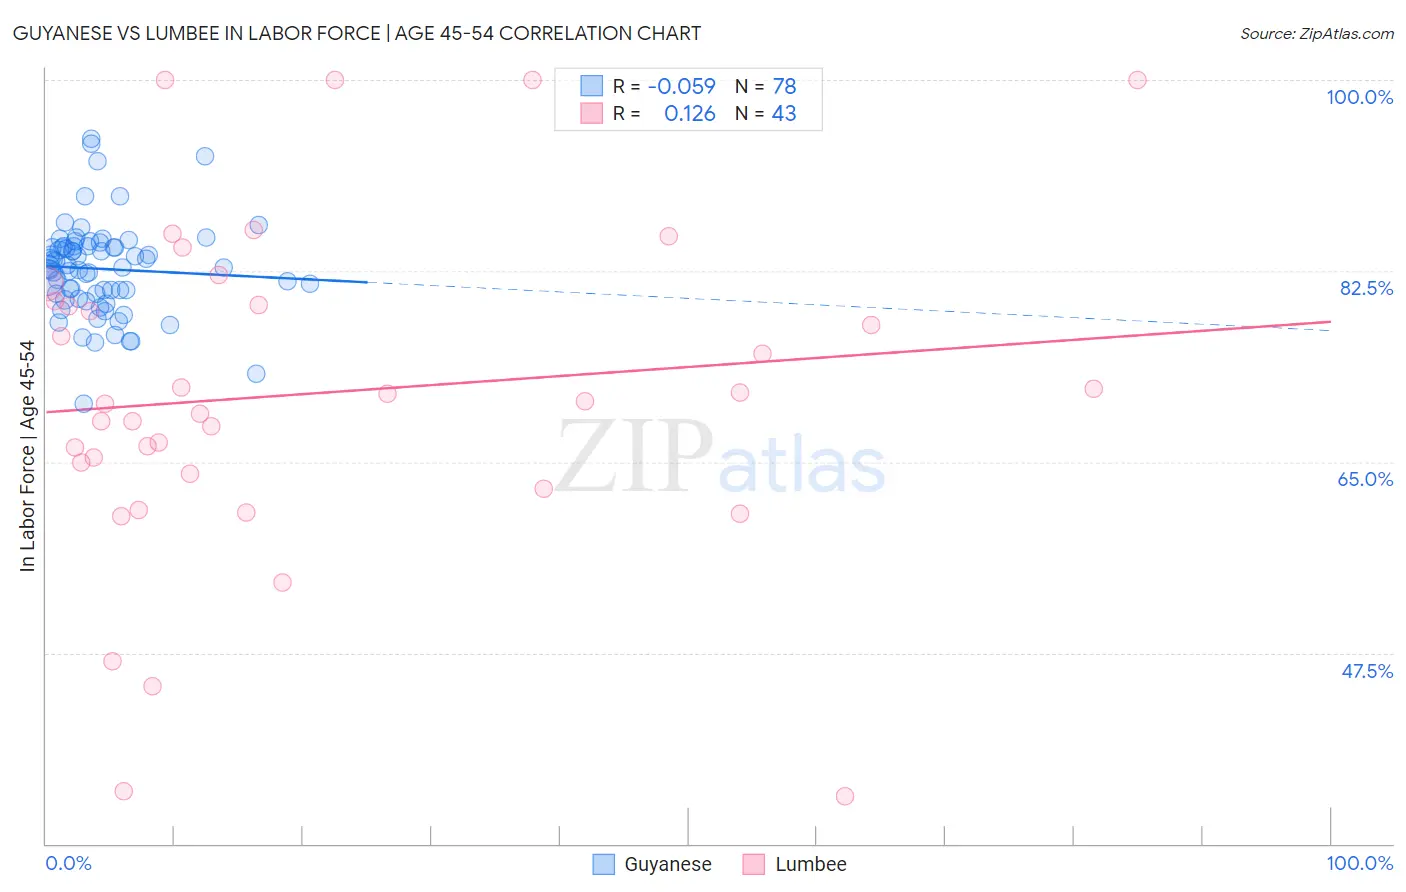
Guyanese vs Lumbee In Labor Force | Age 45-54 Correlation Chart
The statistical analysis conducted on geographies consisting of 176,787,593 people shows a slight negative correlation between the proportion of Guyanese and labor force participation rate among population between the ages 45 and 54 in the United States with a correlation coefficient (R) of -0.059 and weighted average of 81.5%. Similarly, the statistical analysis conducted on geographies consisting of 92,258,023 people shows a poor positive correlation between the proportion of Lumbee and labor force participation rate among population between the ages 45 and 54 in the United States with a correlation coefficient (R) of 0.126 and weighted average of 75.6%, a difference of 7.9%.
In Labor Force | Age 45-54 Correlation Summary
| Measurement | Guyanese | Lumbee |
| Minimum | 70.4% | 34.3% |
| Maximum | 94.6% | 100.0% |
| Range | 24.3% | 65.7% |
| Mean | 82.7% | 71.3% |
| Median | 82.8% | 70.6% |
| Interquartile 25% (IQ1) | 80.4% | 63.9% |
| Interquartile 75% (IQ3) | 84.7% | 79.7% |
| Interquartile Range (IQR) | 4.3% | 15.8% |
| Standard Deviation (Sample) | 4.3% | 15.3% |
| Standard Deviation (Population) | 4.2% | 15.1% |
Similar Demographics by In Labor Force | Age 45-54
Demographics Similar to Guyanese by In Labor Force | Age 45-54
In terms of in labor force | age 45-54, the demographic groups most similar to Guyanese are Immigrants from Fiji (81.5%, a difference of 0.010%), Immigrants from Congo (81.6%, a difference of 0.020%), Spaniard (81.5%, a difference of 0.030%), Barbadian (81.6%, a difference of 0.040%), and Hawaiian (81.5%, a difference of 0.040%).
| Demographics | Rating | Rank | In Labor Force | Age 45-54 |
| Pennsylvania Germans | 0.2 /100 | #252 | Tragic 81.6% |
| Japanese | 0.2 /100 | #253 | Tragic 81.6% |
| Immigrants | Laos | 0.2 /100 | #254 | Tragic 81.6% |
| Scotch-Irish | 0.2 /100 | #255 | Tragic 81.6% |
| Barbadians | 0.1 /100 | #256 | Tragic 81.6% |
| Immigrants | Congo | 0.1 /100 | #257 | Tragic 81.6% |
| Immigrants | Fiji | 0.1 /100 | #258 | Tragic 81.5% |
| Guyanese | 0.1 /100 | #259 | Tragic 81.5% |
| Spaniards | 0.1 /100 | #260 | Tragic 81.5% |
| Hawaiians | 0.1 /100 | #261 | Tragic 81.5% |
| Immigrants | Guyana | 0.1 /100 | #262 | Tragic 81.5% |
| Indonesians | 0.1 /100 | #263 | Tragic 81.5% |
| Immigrants | West Indies | 0.1 /100 | #264 | Tragic 81.5% |
| Hondurans | 0.1 /100 | #265 | Tragic 81.4% |
| Immigrants | St. Vincent and the Grenadines | 0.1 /100 | #266 | Tragic 81.4% |
Demographics Similar to Lumbee by In Labor Force | Age 45-54
In terms of in labor force | age 45-54, the demographic groups most similar to Lumbee are Pueblo (75.5%, a difference of 0.12%), Puerto Rican (75.9%, a difference of 0.46%), Tohono O'odham (75.1%, a difference of 0.61%), Hopi (75.0%, a difference of 0.79%), and Yuman (76.3%, a difference of 0.95%).
| Demographics | Rating | Rank | In Labor Force | Age 45-54 |
| Natives/Alaskans | 0.0 /100 | #333 | Tragic 77.1% |
| Apache | 0.0 /100 | #334 | Tragic 77.1% |
| Arapaho | 0.0 /100 | #335 | Tragic 77.1% |
| Paiute | 0.0 /100 | #336 | Tragic 76.7% |
| Ute | 0.0 /100 | #337 | Tragic 76.6% |
| Yuman | 0.0 /100 | #338 | Tragic 76.3% |
| Puerto Ricans | 0.0 /100 | #339 | Tragic 75.9% |
| Lumbee | 0.0 /100 | #340 | Tragic 75.6% |
| Pueblo | 0.0 /100 | #341 | Tragic 75.5% |
| Tohono O'odham | 0.0 /100 | #342 | Tragic 75.1% |
| Hopi | 0.0 /100 | #343 | Tragic 75.0% |
| Immigrants | Yemen | 0.0 /100 | #344 | Tragic 74.4% |
| Houma | 0.0 /100 | #345 | Tragic 74.1% |
| Pima | 0.0 /100 | #346 | Tragic 72.8% |
| Navajo | 0.0 /100 | #347 | Tragic 72.8% |