Tohono O'odham vs Sioux In Labor Force | Age 45-54
COMPARE
Tohono O'odham
Sioux
In Labor Force | Age 45-54
In Labor Force | Age 45-54 Comparison
Tohono O'odham
Sioux
75.1%
IN LABOR FORCE | AGE 45-54
0.0/ 100
METRIC RATING
342nd/ 347
METRIC RANK
78.0%
IN LABOR FORCE | AGE 45-54
0.0/ 100
METRIC RATING
328th/ 347
METRIC RANK
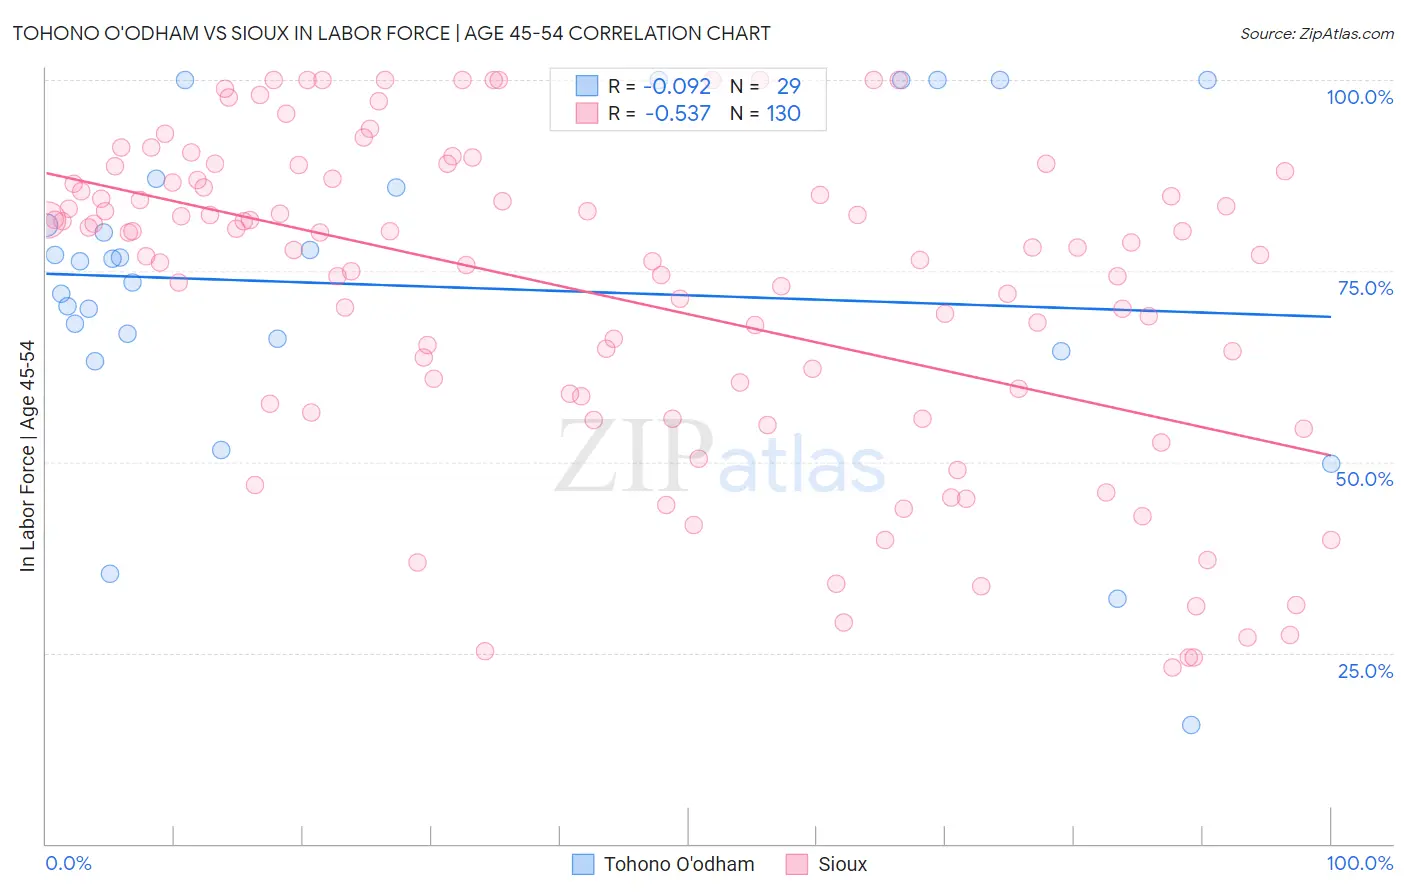
Tohono O'odham vs Sioux In Labor Force | Age 45-54 Correlation Chart
The statistical analysis conducted on geographies consisting of 58,717,652 people shows a slight negative correlation between the proportion of Tohono O'odham and labor force participation rate among population between the ages 45 and 54 in the United States with a correlation coefficient (R) of -0.092 and weighted average of 75.1%. Similarly, the statistical analysis conducted on geographies consisting of 234,094,321 people shows a substantial negative correlation between the proportion of Sioux and labor force participation rate among population between the ages 45 and 54 in the United States with a correlation coefficient (R) of -0.537 and weighted average of 78.0%, a difference of 3.7%.
In Labor Force | Age 45-54 Correlation Summary
| Measurement | Tohono O'odham | Sioux |
| Minimum | 15.5% | 23.0% |
| Maximum | 100.0% | 100.0% |
| Range | 84.5% | 77.0% |
| Mean | 73.0% | 71.7% |
| Median | 76.2% | 77.9% |
| Interquartile 25% (IQ1) | 65.3% | 57.6% |
| Interquartile 75% (IQ3) | 86.5% | 86.6% |
| Interquartile Range (IQR) | 21.2% | 29.0% |
| Standard Deviation (Sample) | 21.2% | 21.0% |
| Standard Deviation (Population) | 20.9% | 21.0% |
Demographics Similar to Tohono O'odham and Sioux by In Labor Force | Age 45-54
In terms of in labor force | age 45-54, the demographic groups most similar to Tohono O'odham are Hopi (75.0%, a difference of 0.18%), Pueblo (75.5%, a difference of 0.49%), Lumbee (75.6%, a difference of 0.61%), Immigrants from Yemen (74.4%, a difference of 0.96%), and Puerto Rican (75.9%, a difference of 1.1%). Similarly, the demographic groups most similar to Sioux are Cajun (78.1%, a difference of 0.22%), Seminole (78.1%, a difference of 0.23%), Choctaw (78.2%, a difference of 0.28%), Creek (77.7%, a difference of 0.29%), and Cheyenne (77.6%, a difference of 0.52%).
| Demographics | Rating | Rank | In Labor Force | Age 45-54 |
| Choctaw | 0.0 /100 | #325 | Tragic 78.2% |
| Seminole | 0.0 /100 | #326 | Tragic 78.1% |
| Cajuns | 0.0 /100 | #327 | Tragic 78.1% |
| Sioux | 0.0 /100 | #328 | Tragic 78.0% |
| Creek | 0.0 /100 | #329 | Tragic 77.7% |
| Cheyenne | 0.0 /100 | #330 | Tragic 77.6% |
| Tsimshian | 0.0 /100 | #331 | Tragic 77.4% |
| Menominee | 0.0 /100 | #332 | Tragic 77.4% |
| Natives/Alaskans | 0.0 /100 | #333 | Tragic 77.1% |
| Apache | 0.0 /100 | #334 | Tragic 77.1% |
| Arapaho | 0.0 /100 | #335 | Tragic 77.1% |
| Paiute | 0.0 /100 | #336 | Tragic 76.7% |
| Ute | 0.0 /100 | #337 | Tragic 76.6% |
| Yuman | 0.0 /100 | #338 | Tragic 76.3% |
| Puerto Ricans | 0.0 /100 | #339 | Tragic 75.9% |
| Lumbee | 0.0 /100 | #340 | Tragic 75.6% |
| Pueblo | 0.0 /100 | #341 | Tragic 75.5% |
| Tohono O'odham | 0.0 /100 | #342 | Tragic 75.1% |
| Hopi | 0.0 /100 | #343 | Tragic 75.0% |
| Immigrants | Yemen | 0.0 /100 | #344 | Tragic 74.4% |
| Houma | 0.0 /100 | #345 | Tragic 74.1% |