Guyanese vs Immigrants from Bolivia In Labor Force | Age 45-54
COMPARE
Guyanese
Immigrants from Bolivia
In Labor Force | Age 45-54
In Labor Force | Age 45-54 Comparison
Guyanese
Immigrants from Bolivia
81.5%
IN LABOR FORCE | AGE 45-54
0.1/ 100
METRIC RATING
259th/ 347
METRIC RANK
85.3%
IN LABOR FORCE | AGE 45-54
100.0/ 100
METRIC RATING
1st/ 347
METRIC RANK
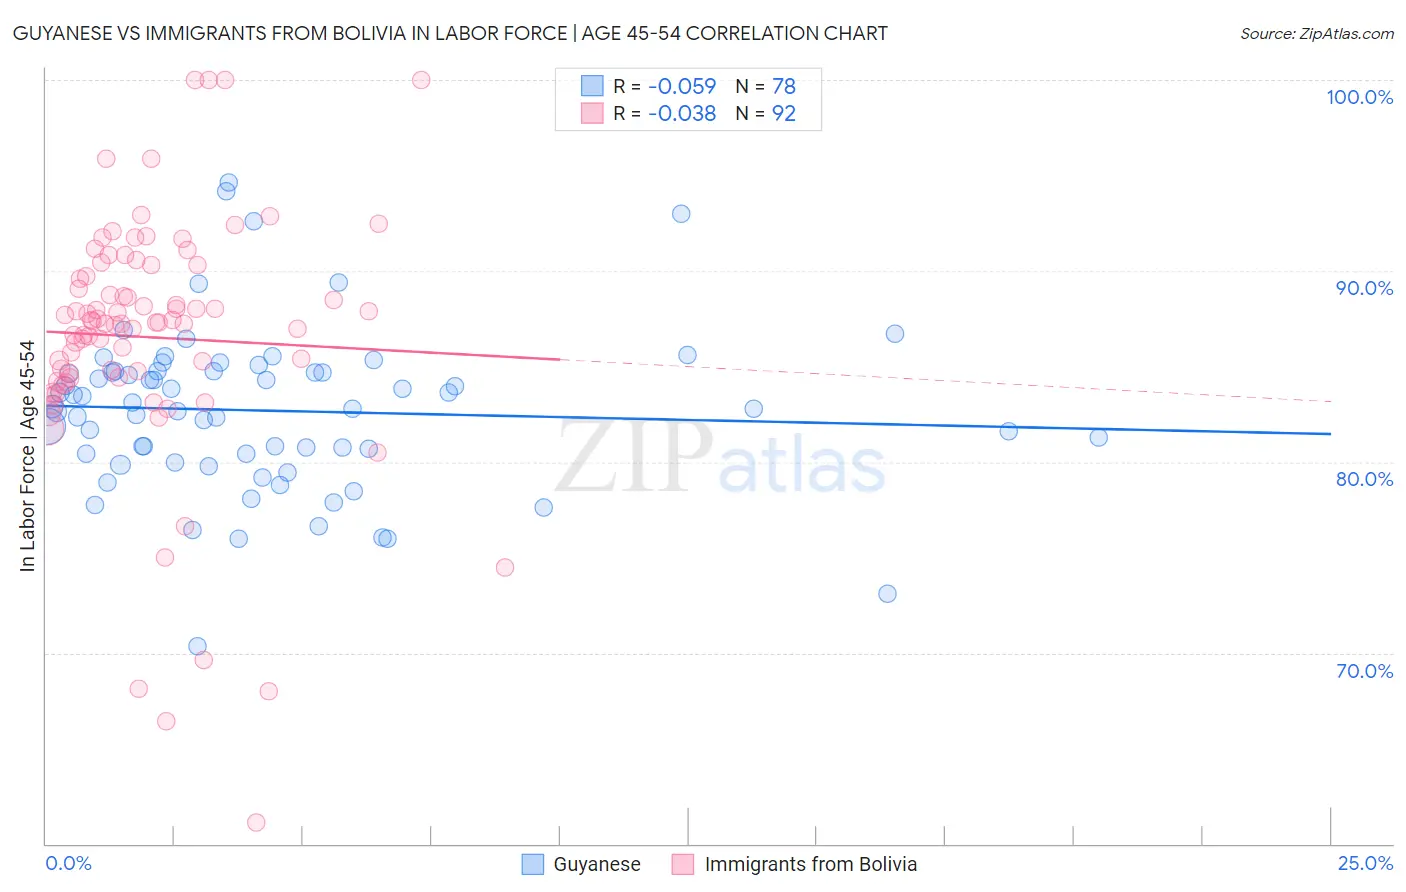
Guyanese vs Immigrants from Bolivia In Labor Force | Age 45-54 Correlation Chart
The statistical analysis conducted on geographies consisting of 176,787,593 people shows a slight negative correlation between the proportion of Guyanese and labor force participation rate among population between the ages 45 and 54 in the United States with a correlation coefficient (R) of -0.059 and weighted average of 81.5%. Similarly, the statistical analysis conducted on geographies consisting of 158,712,400 people shows no correlation between the proportion of Immigrants from Bolivia and labor force participation rate among population between the ages 45 and 54 in the United States with a correlation coefficient (R) of -0.038 and weighted average of 85.3%, a difference of 4.6%.
In Labor Force | Age 45-54 Correlation Summary
| Measurement | Guyanese | Immigrants from Bolivia |
| Minimum | 70.4% | 61.1% |
| Maximum | 94.6% | 100.0% |
| Range | 24.3% | 38.9% |
| Mean | 82.7% | 86.5% |
| Median | 82.8% | 87.3% |
| Interquartile 25% (IQ1) | 80.4% | 84.4% |
| Interquartile 75% (IQ3) | 84.7% | 90.0% |
| Interquartile Range (IQR) | 4.3% | 5.6% |
| Standard Deviation (Sample) | 4.3% | 6.6% |
| Standard Deviation (Population) | 4.2% | 6.6% |
Similar Demographics by In Labor Force | Age 45-54
Demographics Similar to Guyanese by In Labor Force | Age 45-54
In terms of in labor force | age 45-54, the demographic groups most similar to Guyanese are Immigrants from Fiji (81.5%, a difference of 0.010%), Immigrants from Congo (81.6%, a difference of 0.020%), Spaniard (81.5%, a difference of 0.030%), Barbadian (81.6%, a difference of 0.040%), and Hawaiian (81.5%, a difference of 0.040%).
| Demographics | Rating | Rank | In Labor Force | Age 45-54 |
| Pennsylvania Germans | 0.2 /100 | #252 | Tragic 81.6% |
| Japanese | 0.2 /100 | #253 | Tragic 81.6% |
| Immigrants | Laos | 0.2 /100 | #254 | Tragic 81.6% |
| Scotch-Irish | 0.2 /100 | #255 | Tragic 81.6% |
| Barbadians | 0.1 /100 | #256 | Tragic 81.6% |
| Immigrants | Congo | 0.1 /100 | #257 | Tragic 81.6% |
| Immigrants | Fiji | 0.1 /100 | #258 | Tragic 81.5% |
| Guyanese | 0.1 /100 | #259 | Tragic 81.5% |
| Spaniards | 0.1 /100 | #260 | Tragic 81.5% |
| Hawaiians | 0.1 /100 | #261 | Tragic 81.5% |
| Immigrants | Guyana | 0.1 /100 | #262 | Tragic 81.5% |
| Indonesians | 0.1 /100 | #263 | Tragic 81.5% |
| Immigrants | West Indies | 0.1 /100 | #264 | Tragic 81.5% |
| Hondurans | 0.1 /100 | #265 | Tragic 81.4% |
| Immigrants | St. Vincent and the Grenadines | 0.1 /100 | #266 | Tragic 81.4% |
Demographics Similar to Immigrants from Bolivia by In Labor Force | Age 45-54
In terms of in labor force | age 45-54, the demographic groups most similar to Immigrants from Bolivia are Luxembourger (85.0%, a difference of 0.34%), Bolivian (84.9%, a difference of 0.43%), Immigrants from Ethiopia (84.8%, a difference of 0.55%), Ethiopian (84.8%, a difference of 0.63%), and Immigrants from India (84.7%, a difference of 0.74%).
| Demographics | Rating | Rank | In Labor Force | Age 45-54 |
| Immigrants | Bolivia | 100.0 /100 | #1 | Exceptional 85.3% |
| Luxembourgers | 100.0 /100 | #2 | Exceptional 85.0% |
| Bolivians | 100.0 /100 | #3 | Exceptional 84.9% |
| Immigrants | Ethiopia | 100.0 /100 | #4 | Exceptional 84.8% |
| Ethiopians | 100.0 /100 | #5 | Exceptional 84.8% |
| Immigrants | India | 100.0 /100 | #6 | Exceptional 84.7% |
| Immigrants | Cameroon | 100.0 /100 | #7 | Exceptional 84.6% |
| Sierra Leoneans | 100.0 /100 | #8 | Exceptional 84.5% |
| Immigrants | Sierra Leone | 100.0 /100 | #9 | Exceptional 84.4% |
| Norwegians | 100.0 /100 | #10 | Exceptional 84.4% |
| Thais | 100.0 /100 | #11 | Exceptional 84.3% |
| Bulgarians | 100.0 /100 | #12 | Exceptional 84.2% |
| Chinese | 99.9 /100 | #13 | Exceptional 84.1% |
| Cambodians | 99.9 /100 | #14 | Exceptional 84.1% |
| Cypriots | 99.9 /100 | #15 | Exceptional 84.1% |