Immigrants from India vs Immigrants from North Macedonia In Labor Force | Age 45-54
COMPARE
Immigrants from India
Immigrants from North Macedonia
In Labor Force | Age 45-54
In Labor Force | Age 45-54 Comparison
Immigrants from India
Immigrants from North Macedonia
84.7%
IN LABOR FORCE | AGE 45-54
100.0/ 100
METRIC RATING
6th/ 347
METRIC RANK
83.9%
IN LABOR FORCE | AGE 45-54
99.8/ 100
METRIC RATING
25th/ 347
METRIC RANK
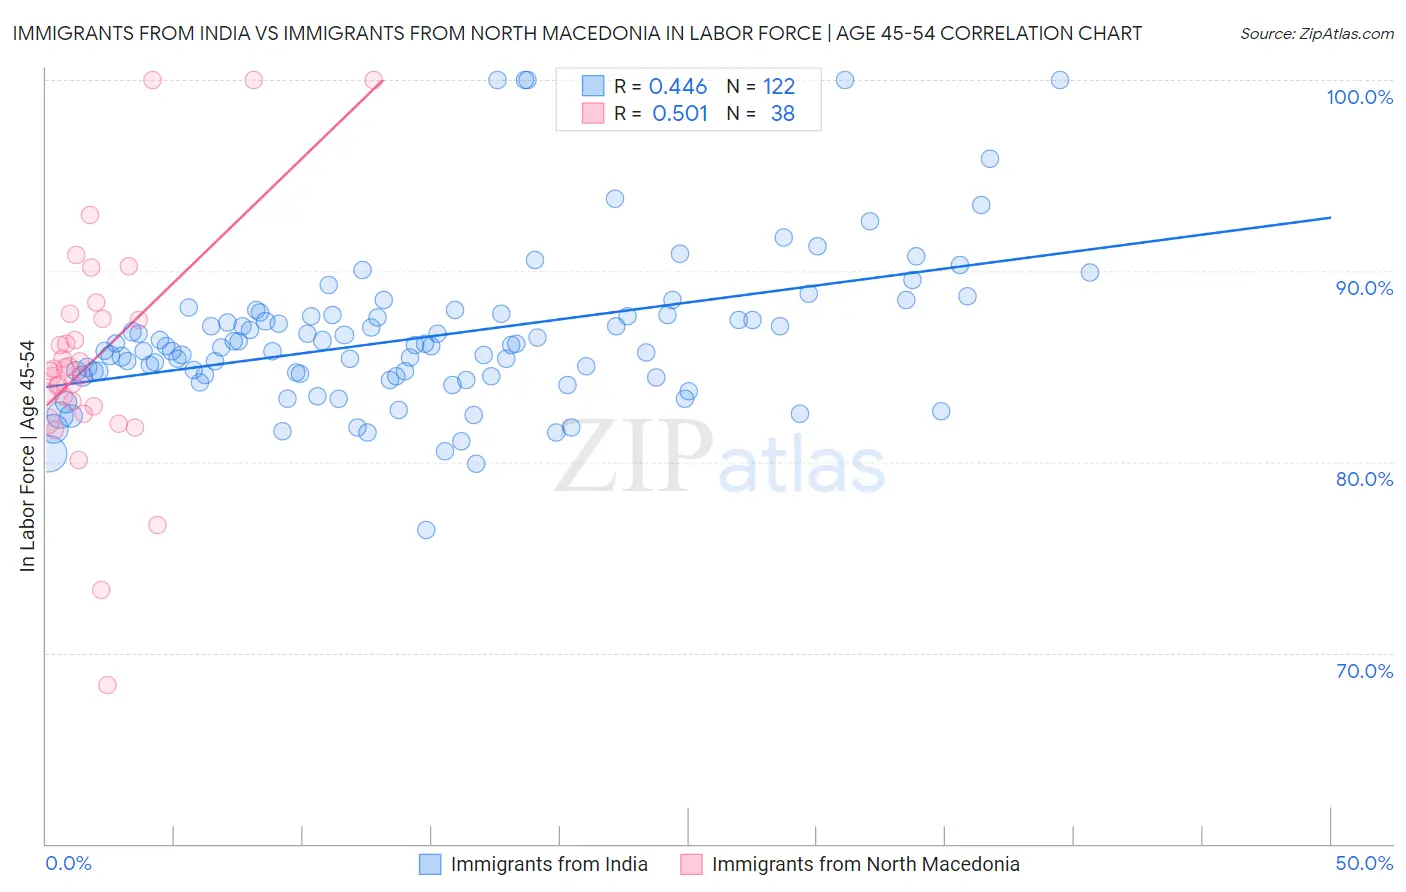
Immigrants from India vs Immigrants from North Macedonia In Labor Force | Age 45-54 Correlation Chart
The statistical analysis conducted on geographies consisting of 433,718,001 people shows a moderate positive correlation between the proportion of Immigrants from India and labor force participation rate among population between the ages 45 and 54 in the United States with a correlation coefficient (R) of 0.446 and weighted average of 84.7%. Similarly, the statistical analysis conducted on geographies consisting of 74,300,796 people shows a substantial positive correlation between the proportion of Immigrants from North Macedonia and labor force participation rate among population between the ages 45 and 54 in the United States with a correlation coefficient (R) of 0.501 and weighted average of 83.9%, a difference of 0.92%.
In Labor Force | Age 45-54 Correlation Summary
| Measurement | Immigrants from India | Immigrants from North Macedonia |
| Minimum | 76.4% | 68.3% |
| Maximum | 100.0% | 100.0% |
| Range | 23.6% | 31.7% |
| Mean | 86.5% | 85.4% |
| Median | 86.0% | 84.8% |
| Interquartile 25% (IQ1) | 84.5% | 82.9% |
| Interquartile 75% (IQ3) | 87.7% | 87.5% |
| Interquartile Range (IQR) | 3.2% | 4.6% |
| Standard Deviation (Sample) | 4.0% | 6.2% |
| Standard Deviation (Population) | 4.0% | 6.1% |
Demographics Similar to Immigrants from India and Immigrants from North Macedonia by In Labor Force | Age 45-54
In terms of in labor force | age 45-54, the demographic groups most similar to Immigrants from India are Immigrants from Cameroon (84.6%, a difference of 0.070%), Ethiopian (84.8%, a difference of 0.11%), Sierra Leonean (84.5%, a difference of 0.18%), Immigrants from Sierra Leone (84.4%, a difference of 0.28%), and Norwegian (84.4%, a difference of 0.30%). Similarly, the demographic groups most similar to Immigrants from North Macedonia are Slovene (83.9%, a difference of 0.030%), Immigrants from Eastern Africa (83.9%, a difference of 0.040%), Immigrants from Sri Lanka (83.9%, a difference of 0.040%), Immigrants from Ireland (83.9%, a difference of 0.040%), and Tlingit-Haida (83.9%, a difference of 0.040%).
| Demographics | Rating | Rank | In Labor Force | Age 45-54 |
| Ethiopians | 100.0 /100 | #5 | Exceptional 84.8% |
| Immigrants | India | 100.0 /100 | #6 | Exceptional 84.7% |
| Immigrants | Cameroon | 100.0 /100 | #7 | Exceptional 84.6% |
| Sierra Leoneans | 100.0 /100 | #8 | Exceptional 84.5% |
| Immigrants | Sierra Leone | 100.0 /100 | #9 | Exceptional 84.4% |
| Norwegians | 100.0 /100 | #10 | Exceptional 84.4% |
| Thais | 100.0 /100 | #11 | Exceptional 84.3% |
| Bulgarians | 100.0 /100 | #12 | Exceptional 84.2% |
| Chinese | 99.9 /100 | #13 | Exceptional 84.1% |
| Cambodians | 99.9 /100 | #14 | Exceptional 84.1% |
| Cypriots | 99.9 /100 | #15 | Exceptional 84.1% |
| Immigrants | Nepal | 99.9 /100 | #16 | Exceptional 84.0% |
| Zimbabweans | 99.9 /100 | #17 | Exceptional 84.0% |
| Immigrants | South Central Asia | 99.9 /100 | #18 | Exceptional 84.0% |
| Czechs | 99.8 /100 | #19 | Exceptional 83.9% |
| Immigrants | Eastern Africa | 99.8 /100 | #20 | Exceptional 83.9% |
| Immigrants | Sri Lanka | 99.8 /100 | #21 | Exceptional 83.9% |
| Immigrants | Ireland | 99.8 /100 | #22 | Exceptional 83.9% |
| Tlingit-Haida | 99.8 /100 | #23 | Exceptional 83.9% |
| Slovenes | 99.8 /100 | #24 | Exceptional 83.9% |
| Immigrants | North Macedonia | 99.8 /100 | #25 | Exceptional 83.9% |