Immigrants from Haiti vs Immigrants from North Macedonia In Labor Force | Age 45-54
COMPARE
Immigrants from Haiti
Immigrants from North Macedonia
In Labor Force | Age 45-54
In Labor Force | Age 45-54 Comparison
Immigrants from Haiti
Immigrants from North Macedonia
83.0%
IN LABOR FORCE | AGE 45-54
77.9/ 100
METRIC RATING
141st/ 347
METRIC RANK
83.9%
IN LABOR FORCE | AGE 45-54
99.8/ 100
METRIC RATING
25th/ 347
METRIC RANK
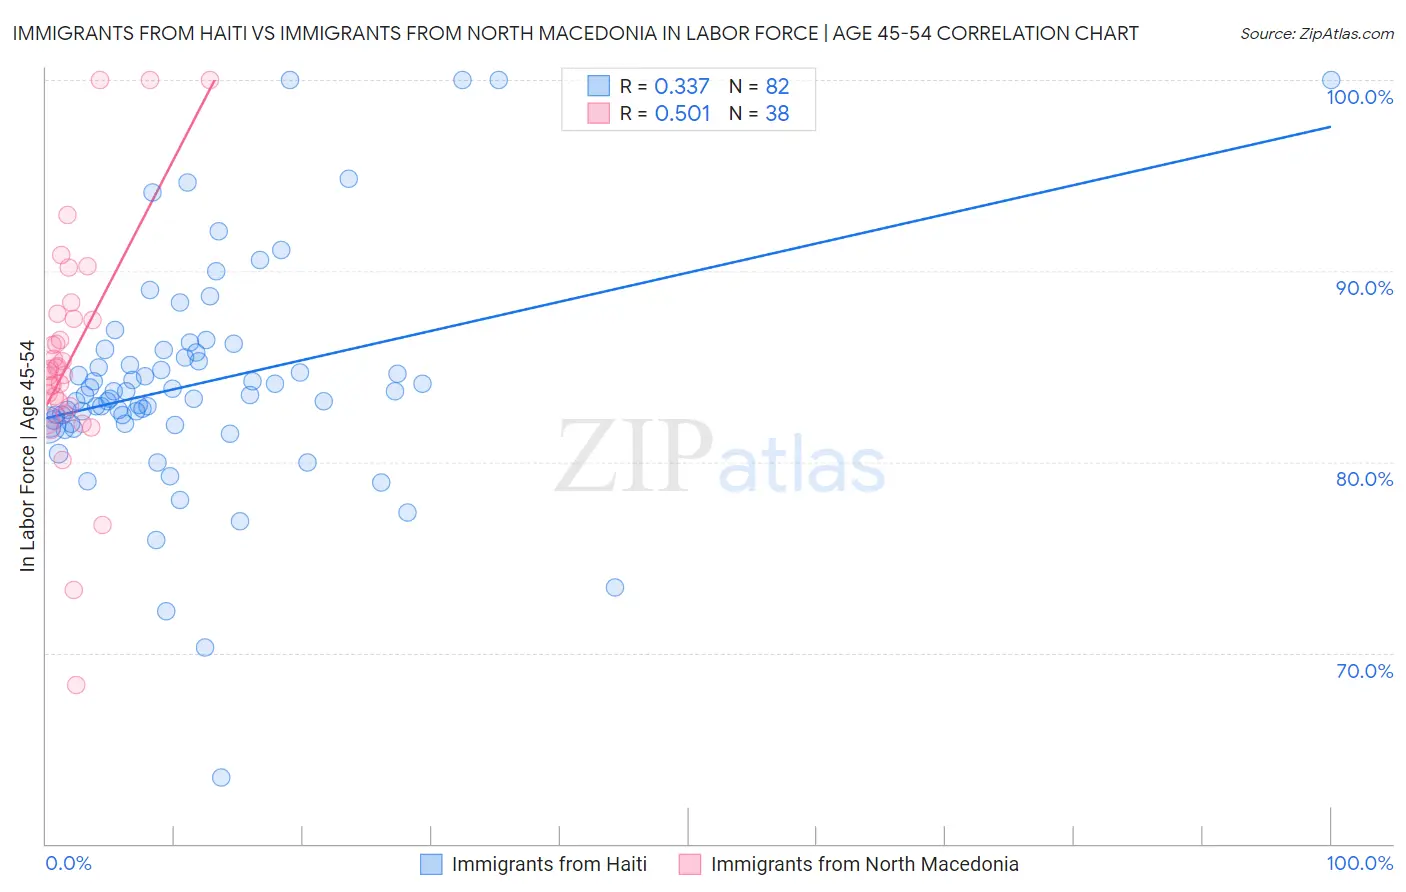
Immigrants from Haiti vs Immigrants from North Macedonia In Labor Force | Age 45-54 Correlation Chart
The statistical analysis conducted on geographies consisting of 225,182,151 people shows a mild positive correlation between the proportion of Immigrants from Haiti and labor force participation rate among population between the ages 45 and 54 in the United States with a correlation coefficient (R) of 0.337 and weighted average of 83.0%. Similarly, the statistical analysis conducted on geographies consisting of 74,300,796 people shows a substantial positive correlation between the proportion of Immigrants from North Macedonia and labor force participation rate among population between the ages 45 and 54 in the United States with a correlation coefficient (R) of 0.501 and weighted average of 83.9%, a difference of 1.1%.
In Labor Force | Age 45-54 Correlation Summary
| Measurement | Immigrants from Haiti | Immigrants from North Macedonia |
| Minimum | 63.5% | 68.3% |
| Maximum | 100.0% | 100.0% |
| Range | 36.5% | 31.7% |
| Mean | 84.1% | 85.4% |
| Median | 83.5% | 84.8% |
| Interquartile 25% (IQ1) | 82.0% | 82.9% |
| Interquartile 75% (IQ3) | 85.7% | 87.5% |
| Interquartile Range (IQR) | 3.7% | 4.6% |
| Standard Deviation (Sample) | 6.0% | 6.2% |
| Standard Deviation (Population) | 5.9% | 6.1% |
Similar Demographics by In Labor Force | Age 45-54
Demographics Similar to Immigrants from Haiti by In Labor Force | Age 45-54
In terms of in labor force | age 45-54, the demographic groups most similar to Immigrants from Haiti are Immigrants from Scotland (83.0%, a difference of 0.0%), Scandinavian (83.0%, a difference of 0.010%), Yugoslavian (83.0%, a difference of 0.010%), Okinawan (83.0%, a difference of 0.010%), and Soviet Union (83.0%, a difference of 0.010%).
| Demographics | Rating | Rank | In Labor Force | Age 45-54 |
| Sudanese | 82.0 /100 | #134 | Excellent 83.0% |
| Austrians | 81.3 /100 | #135 | Excellent 83.0% |
| Immigrants | Kazakhstan | 81.0 /100 | #136 | Excellent 83.0% |
| Immigrants | Spain | 80.4 /100 | #137 | Excellent 83.0% |
| Ghanaians | 79.5 /100 | #138 | Good 83.0% |
| Scandinavians | 78.5 /100 | #139 | Good 83.0% |
| Yugoslavians | 78.3 /100 | #140 | Good 83.0% |
| Immigrants | Haiti | 77.9 /100 | #141 | Good 83.0% |
| Immigrants | Scotland | 77.8 /100 | #142 | Good 83.0% |
| Okinawans | 77.0 /100 | #143 | Good 83.0% |
| Soviet Union | 76.8 /100 | #144 | Good 83.0% |
| Romanians | 75.4 /100 | #145 | Good 83.0% |
| Immigrants | France | 75.3 /100 | #146 | Good 83.0% |
| Czechoslovakians | 74.8 /100 | #147 | Good 83.0% |
| Immigrants | Nigeria | 74.1 /100 | #148 | Good 83.0% |
Demographics Similar to Immigrants from North Macedonia by In Labor Force | Age 45-54
In terms of in labor force | age 45-54, the demographic groups most similar to Immigrants from North Macedonia are Immigrants from Serbia (83.9%, a difference of 0.010%), Immigrants from Brazil (83.9%, a difference of 0.020%), Slovene (83.9%, a difference of 0.030%), Immigrants from Lithuania (83.9%, a difference of 0.030%), and Immigrants from Eastern Africa (83.9%, a difference of 0.040%).
| Demographics | Rating | Rank | In Labor Force | Age 45-54 |
| Immigrants | South Central Asia | 99.9 /100 | #18 | Exceptional 84.0% |
| Czechs | 99.8 /100 | #19 | Exceptional 83.9% |
| Immigrants | Eastern Africa | 99.8 /100 | #20 | Exceptional 83.9% |
| Immigrants | Sri Lanka | 99.8 /100 | #21 | Exceptional 83.9% |
| Immigrants | Ireland | 99.8 /100 | #22 | Exceptional 83.9% |
| Tlingit-Haida | 99.8 /100 | #23 | Exceptional 83.9% |
| Slovenes | 99.8 /100 | #24 | Exceptional 83.9% |
| Immigrants | North Macedonia | 99.8 /100 | #25 | Exceptional 83.9% |
| Immigrants | Serbia | 99.8 /100 | #26 | Exceptional 83.9% |
| Immigrants | Brazil | 99.8 /100 | #27 | Exceptional 83.9% |
| Immigrants | Lithuania | 99.8 /100 | #28 | Exceptional 83.9% |
| Immigrants | Pakistan | 99.7 /100 | #29 | Exceptional 83.8% |
| Immigrants | Bulgaria | 99.7 /100 | #30 | Exceptional 83.8% |
| Immigrants | Eritrea | 99.7 /100 | #31 | Exceptional 83.8% |
| Turks | 99.7 /100 | #32 | Exceptional 83.8% |