Immigrants from Somalia vs Immigrants from North Macedonia In Labor Force | Age 45-54
COMPARE
Immigrants from Somalia
Immigrants from North Macedonia
In Labor Force | Age 45-54
In Labor Force | Age 45-54 Comparison
Immigrants from Somalia
Immigrants from North Macedonia
83.4%
IN LABOR FORCE | AGE 45-54
96.9/ 100
METRIC RATING
74th/ 347
METRIC RANK
83.9%
IN LABOR FORCE | AGE 45-54
99.8/ 100
METRIC RATING
25th/ 347
METRIC RANK
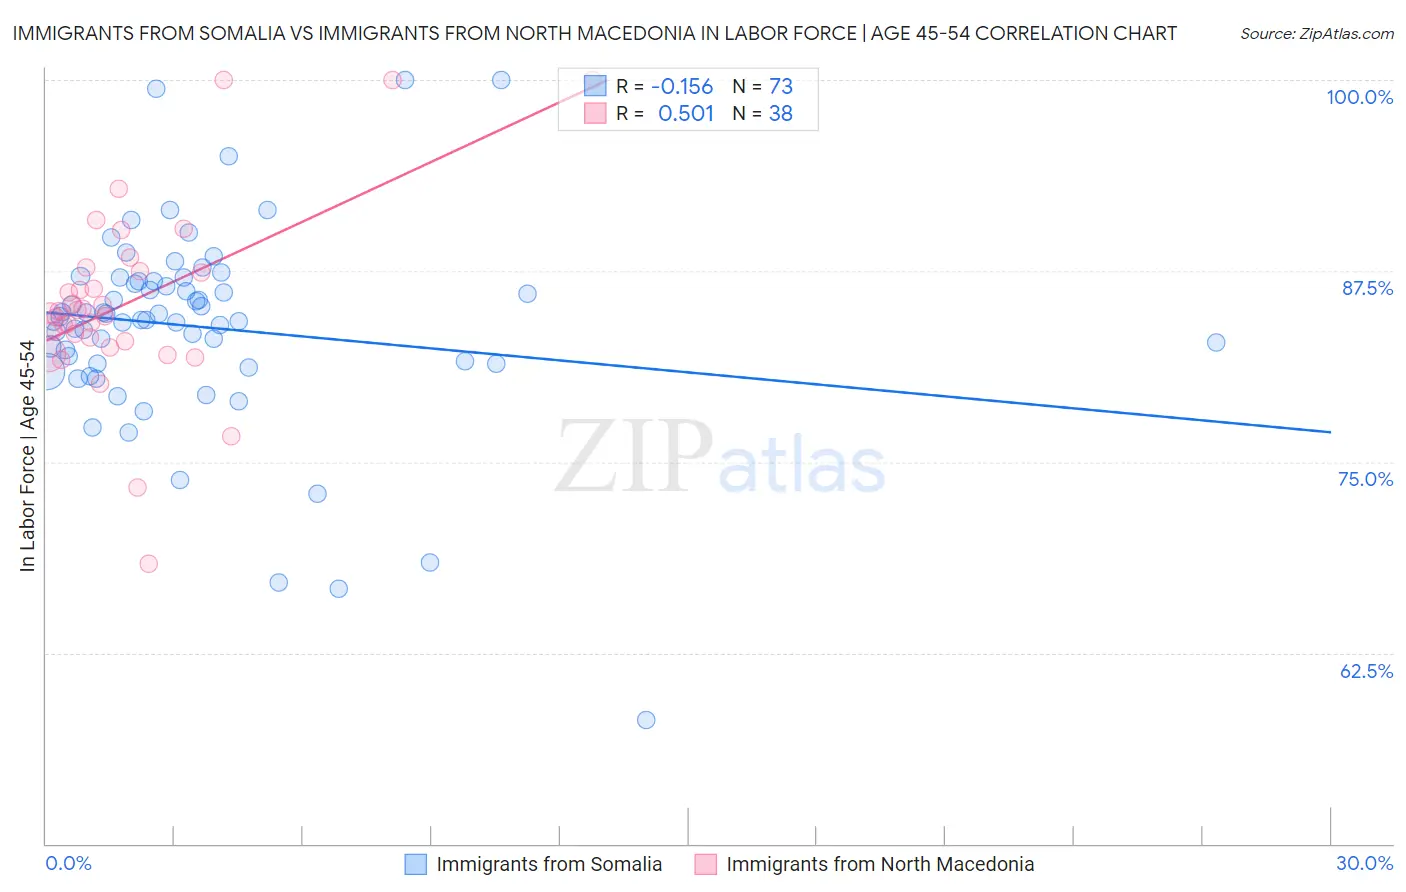
Immigrants from Somalia vs Immigrants from North Macedonia In Labor Force | Age 45-54 Correlation Chart
The statistical analysis conducted on geographies consisting of 92,094,629 people shows a poor negative correlation between the proportion of Immigrants from Somalia and labor force participation rate among population between the ages 45 and 54 in the United States with a correlation coefficient (R) of -0.156 and weighted average of 83.4%. Similarly, the statistical analysis conducted on geographies consisting of 74,300,796 people shows a substantial positive correlation between the proportion of Immigrants from North Macedonia and labor force participation rate among population between the ages 45 and 54 in the United States with a correlation coefficient (R) of 0.501 and weighted average of 83.9%, a difference of 0.60%.
In Labor Force | Age 45-54 Correlation Summary
| Measurement | Immigrants from Somalia | Immigrants from North Macedonia |
| Minimum | 58.1% | 68.3% |
| Maximum | 100.0% | 100.0% |
| Range | 41.9% | 31.7% |
| Mean | 83.9% | 85.4% |
| Median | 84.3% | 84.8% |
| Interquartile 25% (IQ1) | 81.4% | 82.9% |
| Interquartile 75% (IQ3) | 86.8% | 87.5% |
| Interquartile Range (IQR) | 5.4% | 4.6% |
| Standard Deviation (Sample) | 6.7% | 6.2% |
| Standard Deviation (Population) | 6.7% | 6.1% |
Similar Demographics by In Labor Force | Age 45-54
Demographics Similar to Immigrants from Somalia by In Labor Force | Age 45-54
In terms of in labor force | age 45-54, the demographic groups most similar to Immigrants from Somalia are Estonian (83.4%, a difference of 0.0%), Russian (83.4%, a difference of 0.0%), Immigrants from Czechoslovakia (83.4%, a difference of 0.010%), Cuban (83.4%, a difference of 0.010%), and Serbian (83.4%, a difference of 0.020%).
| Demographics | Rating | Rank | In Labor Force | Age 45-54 |
| Chileans | 97.7 /100 | #67 | Exceptional 83.4% |
| Immigrants | Colombia | 97.6 /100 | #68 | Exceptional 83.4% |
| Taiwanese | 97.5 /100 | #69 | Exceptional 83.4% |
| Immigrants | Latvia | 97.4 /100 | #70 | Exceptional 83.4% |
| Colombians | 97.3 /100 | #71 | Exceptional 83.4% |
| Serbians | 97.2 /100 | #72 | Exceptional 83.4% |
| Immigrants | Czechoslovakia | 97.1 /100 | #73 | Exceptional 83.4% |
| Immigrants | Somalia | 96.9 /100 | #74 | Exceptional 83.4% |
| Estonians | 96.9 /100 | #75 | Exceptional 83.4% |
| Russians | 96.8 /100 | #76 | Exceptional 83.4% |
| Cubans | 96.7 /100 | #77 | Exceptional 83.4% |
| Immigrants | Egypt | 96.6 /100 | #78 | Exceptional 83.4% |
| Belgians | 96.5 /100 | #79 | Exceptional 83.4% |
| Immigrants | Croatia | 96.5 /100 | #80 | Exceptional 83.4% |
| Jordanians | 96.4 /100 | #81 | Exceptional 83.4% |
Demographics Similar to Immigrants from North Macedonia by In Labor Force | Age 45-54
In terms of in labor force | age 45-54, the demographic groups most similar to Immigrants from North Macedonia are Immigrants from Serbia (83.9%, a difference of 0.010%), Immigrants from Brazil (83.9%, a difference of 0.020%), Slovene (83.9%, a difference of 0.030%), Immigrants from Lithuania (83.9%, a difference of 0.030%), and Immigrants from Eastern Africa (83.9%, a difference of 0.040%).
| Demographics | Rating | Rank | In Labor Force | Age 45-54 |
| Immigrants | South Central Asia | 99.9 /100 | #18 | Exceptional 84.0% |
| Czechs | 99.8 /100 | #19 | Exceptional 83.9% |
| Immigrants | Eastern Africa | 99.8 /100 | #20 | Exceptional 83.9% |
| Immigrants | Sri Lanka | 99.8 /100 | #21 | Exceptional 83.9% |
| Immigrants | Ireland | 99.8 /100 | #22 | Exceptional 83.9% |
| Tlingit-Haida | 99.8 /100 | #23 | Exceptional 83.9% |
| Slovenes | 99.8 /100 | #24 | Exceptional 83.9% |
| Immigrants | North Macedonia | 99.8 /100 | #25 | Exceptional 83.9% |
| Immigrants | Serbia | 99.8 /100 | #26 | Exceptional 83.9% |
| Immigrants | Brazil | 99.8 /100 | #27 | Exceptional 83.9% |
| Immigrants | Lithuania | 99.8 /100 | #28 | Exceptional 83.9% |
| Immigrants | Pakistan | 99.7 /100 | #29 | Exceptional 83.8% |
| Immigrants | Bulgaria | 99.7 /100 | #30 | Exceptional 83.8% |
| Immigrants | Eritrea | 99.7 /100 | #31 | Exceptional 83.8% |
| Turks | 99.7 /100 | #32 | Exceptional 83.8% |