Guyanese vs Guatemalan No Schooling Completed
COMPARE
Guyanese
Guatemalan
No Schooling Completed
No Schooling Completed Comparison
Guyanese
Guatemalans
3.0%
NO SCHOOLING COMPLETED
0.0/ 100
METRIC RATING
310th/ 347
METRIC RANK
3.5%
NO SCHOOLING COMPLETED
0.0/ 100
METRIC RATING
334th/ 347
METRIC RANK
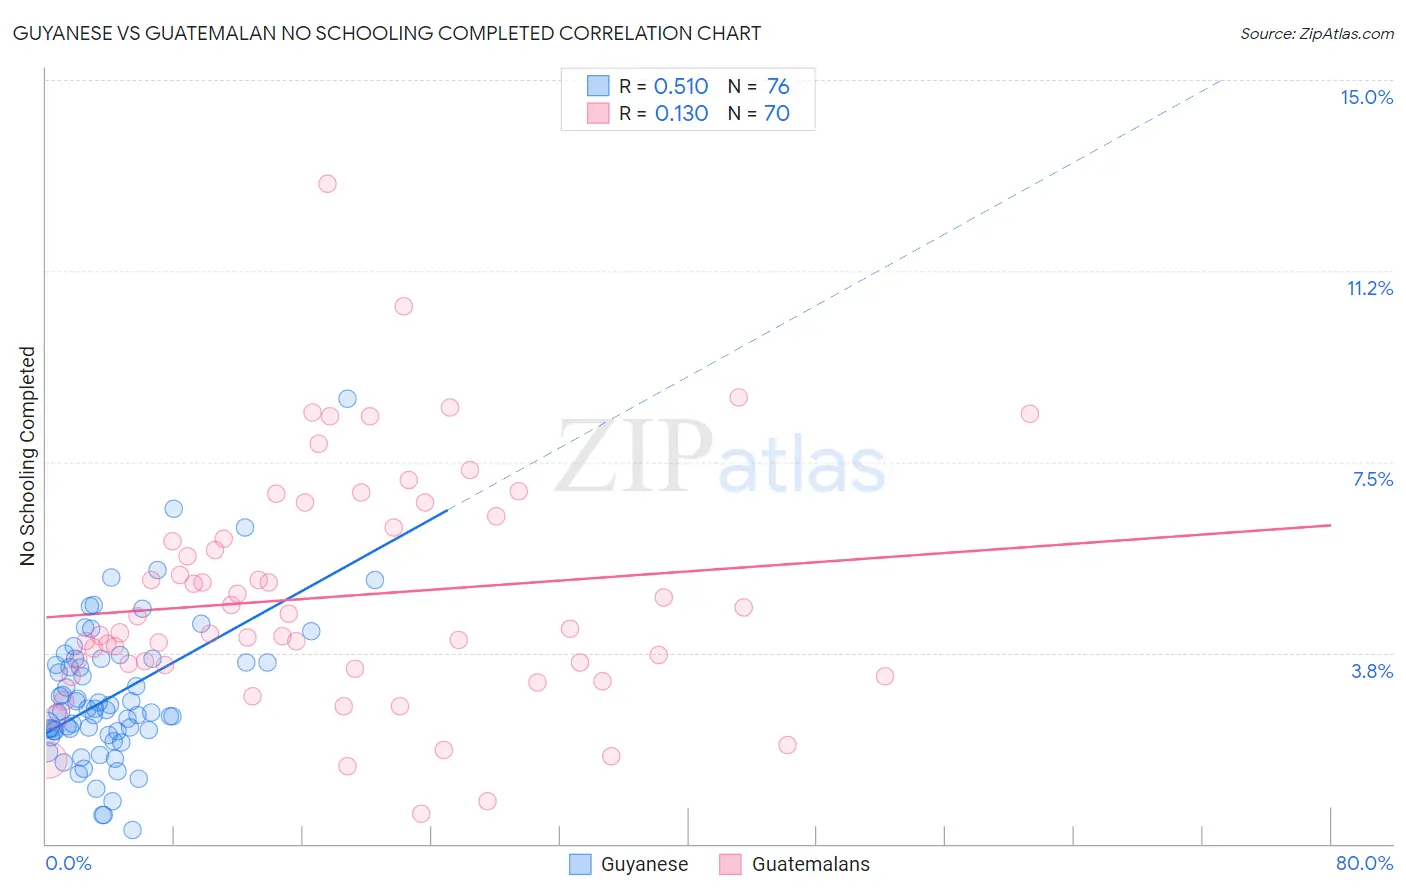
Guyanese vs Guatemalan No Schooling Completed Correlation Chart
The statistical analysis conducted on geographies consisting of 176,268,002 people shows a substantial positive correlation between the proportion of Guyanese and percentage of population with no schooling in the United States with a correlation coefficient (R) of 0.510 and weighted average of 3.0%. Similarly, the statistical analysis conducted on geographies consisting of 406,309,514 people shows a poor positive correlation between the proportion of Guatemalans and percentage of population with no schooling in the United States with a correlation coefficient (R) of 0.130 and weighted average of 3.5%, a difference of 13.9%.
No Schooling Completed Correlation Summary
| Measurement | Guyanese | Guatemalan |
| Minimum | 0.26% | 0.59% |
| Maximum | 8.7% | 13.0% |
| Range | 8.5% | 12.4% |
| Mean | 2.9% | 4.9% |
| Median | 2.6% | 4.2% |
| Interquartile 25% (IQ1) | 2.2% | 3.5% |
| Interquartile 75% (IQ3) | 3.6% | 6.2% |
| Interquartile Range (IQR) | 1.4% | 2.7% |
| Standard Deviation (Sample) | 1.4% | 2.3% |
| Standard Deviation (Population) | 1.4% | 2.3% |
Similar Demographics by No Schooling Completed
Demographics Similar to Guyanese by No Schooling Completed
In terms of no schooling completed, the demographic groups most similar to Guyanese are Hispanic or Latino (3.0%, a difference of 0.050%), Immigrants from the Azores (3.0%, a difference of 0.10%), Sri Lankan (3.0%, a difference of 0.38%), Immigrants from Somalia (3.0%, a difference of 0.86%), and Honduran (3.1%, a difference of 0.89%).
| Demographics | Rating | Rank | No Schooling Completed |
| Somalis | 0.0 /100 | #303 | Tragic 2.9% |
| Nicaraguans | 0.0 /100 | #304 | Tragic 2.9% |
| Ecuadorians | 0.0 /100 | #305 | Tragic 3.0% |
| Belizeans | 0.0 /100 | #306 | Tragic 3.0% |
| Immigrants | Haiti | 0.0 /100 | #307 | Tragic 3.0% |
| Immigrants | Somalia | 0.0 /100 | #308 | Tragic 3.0% |
| Hispanics or Latinos | 0.0 /100 | #309 | Tragic 3.0% |
| Guyanese | 0.0 /100 | #310 | Tragic 3.0% |
| Immigrants | Azores | 0.0 /100 | #311 | Tragic 3.0% |
| Sri Lankans | 0.0 /100 | #312 | Tragic 3.0% |
| Hondurans | 0.0 /100 | #313 | Tragic 3.1% |
| Immigrants | Belize | 0.0 /100 | #314 | Tragic 3.1% |
| Immigrants | Nicaragua | 0.0 /100 | #315 | Tragic 3.1% |
| Immigrants | Ecuador | 0.0 /100 | #316 | Tragic 3.1% |
| Cape Verdeans | 0.0 /100 | #317 | Tragic 3.1% |
Demographics Similar to Guatemalans by No Schooling Completed
In terms of no schooling completed, the demographic groups most similar to Guatemalans are Immigrants from Cambodia (3.5%, a difference of 1.0%), Immigrants from Fiji (3.5%, a difference of 1.4%), Immigrants from Dominican Republic (3.4%, a difference of 1.8%), Central American (3.4%, a difference of 1.8%), and Immigrants from Cabo Verde (3.5%, a difference of 2.1%).
| Demographics | Rating | Rank | No Schooling Completed |
| Immigrants | Latin America | 0.0 /100 | #327 | Tragic 3.3% |
| Mexicans | 0.0 /100 | #328 | Tragic 3.3% |
| Immigrants | Vietnam | 0.0 /100 | #329 | Tragic 3.3% |
| Immigrants | Armenia | 0.0 /100 | #330 | Tragic 3.3% |
| Japanese | 0.0 /100 | #331 | Tragic 3.3% |
| Central Americans | 0.0 /100 | #332 | Tragic 3.4% |
| Immigrants | Dominican Republic | 0.0 /100 | #333 | Tragic 3.4% |
| Guatemalans | 0.0 /100 | #334 | Tragic 3.5% |
| Immigrants | Cambodia | 0.0 /100 | #335 | Tragic 3.5% |
| Immigrants | Fiji | 0.0 /100 | #336 | Tragic 3.5% |
| Immigrants | Cabo Verde | 0.0 /100 | #337 | Tragic 3.5% |
| Bangladeshis | 0.0 /100 | #338 | Tragic 3.5% |
| Yakama | 0.0 /100 | #339 | Tragic 3.6% |
| Immigrants | Guatemala | 0.0 /100 | #340 | Tragic 3.6% |
| Immigrants | Central America | 0.0 /100 | #341 | Tragic 3.6% |