Guyanese vs Guatemalan No Vehicles in Household
COMPARE
Guyanese
Guatemalan
No Vehicles in Household
No Vehicles in Household Comparison
Guyanese
Guatemalans
29.3%
NO VEHICLES IN HOUSEHOLD
0.0/ 100
METRIC RATING
338th/ 347
METRIC RANK
11.0%
NO VEHICLES IN HOUSEHOLD
16.1/ 100
METRIC RATING
204th/ 347
METRIC RANK
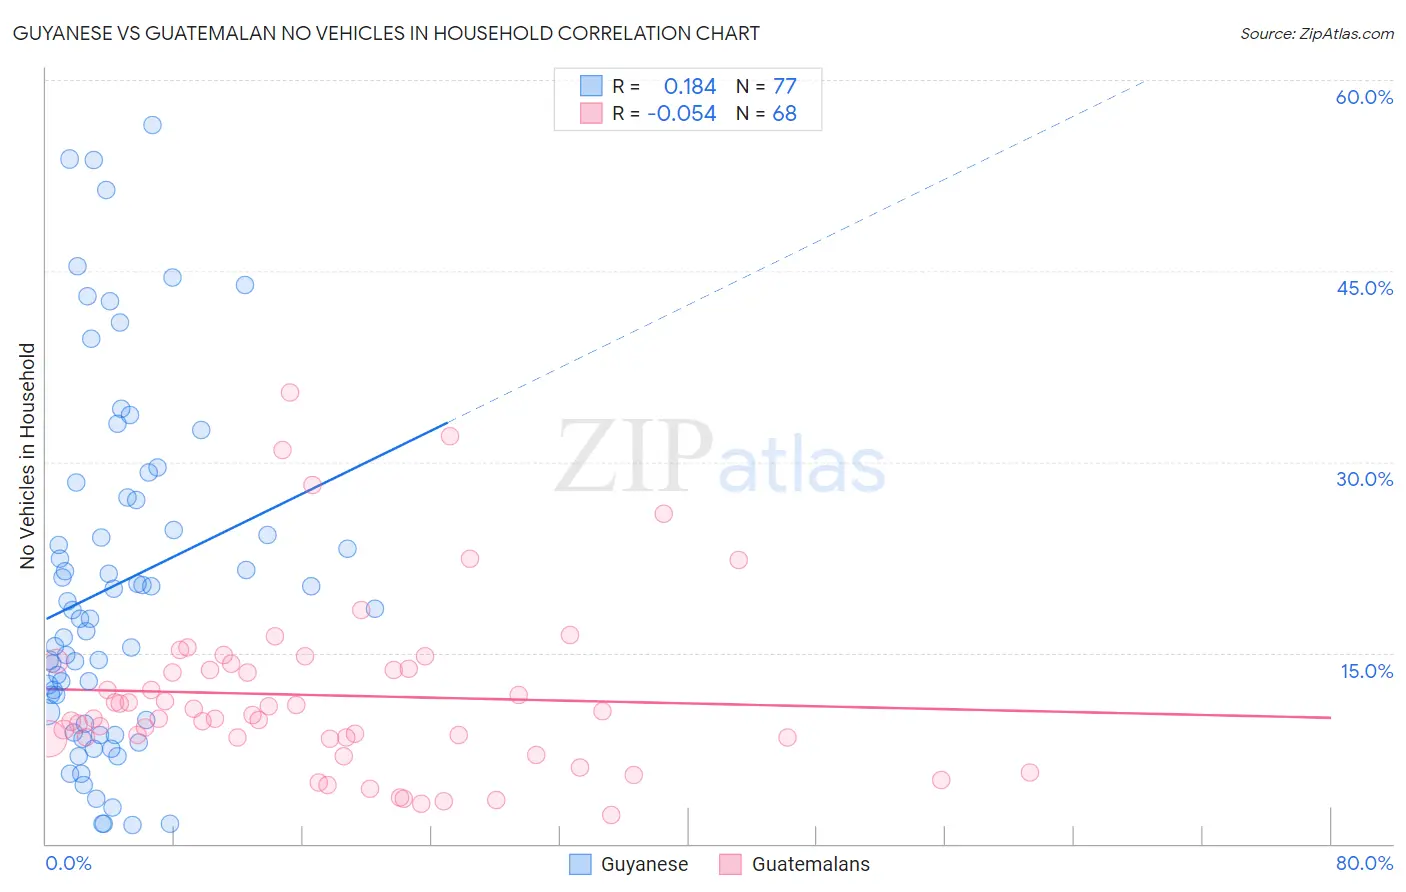
Guyanese vs Guatemalan No Vehicles in Household Correlation Chart
The statistical analysis conducted on geographies consisting of 176,563,698 people shows a poor positive correlation between the proportion of Guyanese and percentage of households with no vehicle available in the United States with a correlation coefficient (R) of 0.184 and weighted average of 29.3%. Similarly, the statistical analysis conducted on geographies consisting of 408,589,655 people shows a slight negative correlation between the proportion of Guatemalans and percentage of households with no vehicle available in the United States with a correlation coefficient (R) of -0.054 and weighted average of 11.0%, a difference of 166.7%.
No Vehicles in Household Correlation Summary
| Measurement | Guyanese | Guatemalan |
| Minimum | 1.4% | 2.3% |
| Maximum | 56.4% | 35.5% |
| Range | 55.0% | 33.2% |
| Mean | 20.3% | 11.7% |
| Median | 17.7% | 10.0% |
| Interquartile 25% (IQ1) | 9.6% | 8.3% |
| Interquartile 75% (IQ3) | 27.1% | 13.9% |
| Interquartile Range (IQR) | 17.6% | 5.6% |
| Standard Deviation (Sample) | 13.7% | 6.9% |
| Standard Deviation (Population) | 13.6% | 6.8% |
Similar Demographics by No Vehicles in Household
Demographics Similar to Guyanese by No Vehicles in Household
In terms of no vehicles in household, the demographic groups most similar to Guyanese are Dominican (29.4%, a difference of 0.36%), Immigrants from Barbados (29.5%, a difference of 0.59%), Immigrants from Guyana (29.5%, a difference of 0.64%), British West Indian (29.7%, a difference of 1.5%), and Inupiat (29.9%, a difference of 1.9%).
| Demographics | Rating | Rank | No Vehicles in Household |
| Trinidadians and Tobagonians | 0.0 /100 | #331 | Tragic 23.7% |
| Immigrants | Ecuador | 0.0 /100 | #332 | Tragic 23.8% |
| Immigrants | Trinidad and Tobago | 0.0 /100 | #333 | Tragic 24.6% |
| Immigrants | Bangladesh | 0.0 /100 | #334 | Tragic 25.8% |
| Barbadians | 0.0 /100 | #335 | Tragic 26.1% |
| Vietnamese | 0.0 /100 | #336 | Tragic 26.2% |
| Immigrants | Uzbekistan | 0.0 /100 | #337 | Tragic 26.7% |
| Guyanese | 0.0 /100 | #338 | Tragic 29.3% |
| Dominicans | 0.0 /100 | #339 | Tragic 29.4% |
| Immigrants | Barbados | 0.0 /100 | #340 | Tragic 29.5% |
| Immigrants | Guyana | 0.0 /100 | #341 | Tragic 29.5% |
| British West Indians | 0.0 /100 | #342 | Tragic 29.7% |
| Inupiat | 0.0 /100 | #343 | Tragic 29.9% |
| Immigrants | Dominican Republic | 0.0 /100 | #344 | Tragic 31.4% |
| Immigrants | St. Vincent and the Grenadines | 0.0 /100 | #345 | Tragic 35.4% |
Demographics Similar to Guatemalans by No Vehicles in Household
In terms of no vehicles in household, the demographic groups most similar to Guatemalans are Immigrants from Chile (11.0%, a difference of 0.040%), Somali (11.0%, a difference of 0.050%), Sierra Leonean (11.0%, a difference of 0.10%), Immigrants from Italy (11.0%, a difference of 0.11%), and Pennsylvania German (11.0%, a difference of 0.14%).
| Demographics | Rating | Rank | No Vehicles in Household |
| Shoshone | 24.1 /100 | #197 | Fair 10.8% |
| Immigrants | Sweden | 22.9 /100 | #198 | Fair 10.8% |
| Immigrants | Asia | 21.3 /100 | #199 | Fair 10.9% |
| Cambodians | 19.6 /100 | #200 | Poor 10.9% |
| Immigrants | Western Europe | 19.1 /100 | #201 | Poor 10.9% |
| Romanians | 17.9 /100 | #202 | Poor 10.9% |
| Iroquois | 17.6 /100 | #203 | Poor 10.9% |
| Guatemalans | 16.1 /100 | #204 | Poor 11.0% |
| Immigrants | Chile | 15.9 /100 | #205 | Poor 11.0% |
| Somalis | 15.9 /100 | #206 | Poor 11.0% |
| Sierra Leoneans | 15.7 /100 | #207 | Poor 11.0% |
| Immigrants | Italy | 15.6 /100 | #208 | Poor 11.0% |
| Pennsylvania Germans | 15.5 /100 | #209 | Poor 11.0% |
| Apache | 14.8 /100 | #210 | Poor 11.0% |
| Crow | 14.2 /100 | #211 | Poor 11.0% |