Afghan vs Guatemalan In Labor Force | Age 45-54
COMPARE
Afghan
Guatemalan
In Labor Force | Age 45-54
In Labor Force | Age 45-54 Comparison
Afghans
Guatemalans
83.5%
IN LABOR FORCE | AGE 45-54
97.9/ 100
METRIC RATING
63rd/ 347
METRIC RANK
81.2%
IN LABOR FORCE | AGE 45-54
0.0/ 100
METRIC RATING
277th/ 347
METRIC RANK
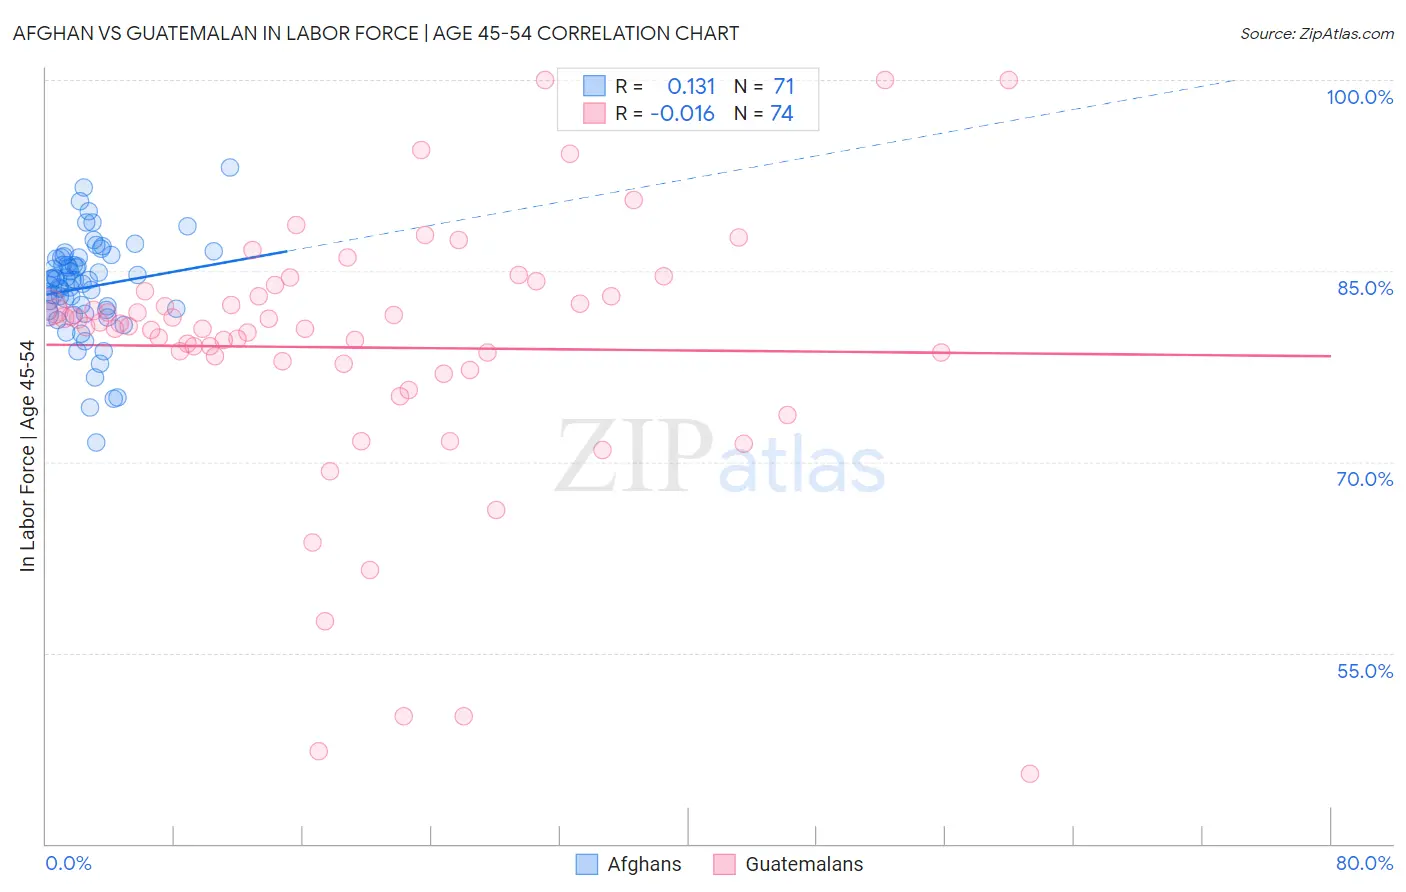
Afghan vs Guatemalan In Labor Force | Age 45-54 Correlation Chart
The statistical analysis conducted on geographies consisting of 148,803,008 people shows a poor positive correlation between the proportion of Afghans and labor force participation rate among population between the ages 45 and 54 in the United States with a correlation coefficient (R) of 0.131 and weighted average of 83.5%. Similarly, the statistical analysis conducted on geographies consisting of 409,275,679 people shows no correlation between the proportion of Guatemalans and labor force participation rate among population between the ages 45 and 54 in the United States with a correlation coefficient (R) of -0.016 and weighted average of 81.2%, a difference of 2.8%.
In Labor Force | Age 45-54 Correlation Summary
| Measurement | Afghan | Guatemalan |
| Minimum | 71.5% | 45.5% |
| Maximum | 93.1% | 100.0% |
| Range | 21.6% | 54.5% |
| Mean | 83.7% | 79.0% |
| Median | 84.3% | 80.6% |
| Interquartile 25% (IQ1) | 81.9% | 77.7% |
| Interquartile 75% (IQ3) | 86.0% | 83.0% |
| Interquartile Range (IQR) | 4.1% | 5.3% |
| Standard Deviation (Sample) | 3.9% | 10.5% |
| Standard Deviation (Population) | 3.8% | 10.4% |
Similar Demographics by In Labor Force | Age 45-54
Demographics Similar to Afghans by In Labor Force | Age 45-54
In terms of in labor force | age 45-54, the demographic groups most similar to Afghans are Immigrants from Kenya (83.5%, a difference of 0.0%), Immigrants from Taiwan (83.5%, a difference of 0.010%), Egyptian (83.5%, a difference of 0.010%), Asian (83.4%, a difference of 0.020%), and Chilean (83.4%, a difference of 0.020%).
| Demographics | Rating | Rank | In Labor Force | Age 45-54 |
| Immigrants | Peru | 98.6 /100 | #56 | Exceptional 83.5% |
| Paraguayans | 98.5 /100 | #57 | Exceptional 83.5% |
| Eastern Europeans | 98.5 /100 | #58 | Exceptional 83.5% |
| Bhutanese | 98.3 /100 | #59 | Exceptional 83.5% |
| Carpatho Rusyns | 98.3 /100 | #60 | Exceptional 83.5% |
| Filipinos | 98.3 /100 | #61 | Exceptional 83.5% |
| Immigrants | Taiwan | 98.0 /100 | #62 | Exceptional 83.5% |
| Afghans | 97.9 /100 | #63 | Exceptional 83.5% |
| Immigrants | Kenya | 97.9 /100 | #64 | Exceptional 83.5% |
| Egyptians | 97.9 /100 | #65 | Exceptional 83.5% |
| Asians | 97.7 /100 | #66 | Exceptional 83.4% |
| Chileans | 97.7 /100 | #67 | Exceptional 83.4% |
| Immigrants | Colombia | 97.6 /100 | #68 | Exceptional 83.4% |
| Taiwanese | 97.5 /100 | #69 | Exceptional 83.4% |
| Immigrants | Latvia | 97.4 /100 | #70 | Exceptional 83.4% |
Demographics Similar to Guatemalans by In Labor Force | Age 45-54
In terms of in labor force | age 45-54, the demographic groups most similar to Guatemalans are U.S. Virgin Islander (81.2%, a difference of 0.020%), Nonimmigrants (81.2%, a difference of 0.060%), British West Indian (81.2%, a difference of 0.070%), Immigrants from Guatemala (81.1%, a difference of 0.080%), and Immigrants from Micronesia (81.1%, a difference of 0.090%).
| Demographics | Rating | Rank | In Labor Force | Age 45-54 |
| Bangladeshis | 0.0 /100 | #270 | Tragic 81.3% |
| Immigrants | Barbados | 0.0 /100 | #271 | Tragic 81.3% |
| Spanish | 0.0 /100 | #272 | Tragic 81.3% |
| Chippewa | 0.0 /100 | #273 | Tragic 81.3% |
| British West Indians | 0.0 /100 | #274 | Tragic 81.2% |
| Immigrants | Nonimmigrants | 0.0 /100 | #275 | Tragic 81.2% |
| U.S. Virgin Islanders | 0.0 /100 | #276 | Tragic 81.2% |
| Guatemalans | 0.0 /100 | #277 | Tragic 81.2% |
| Immigrants | Guatemala | 0.0 /100 | #278 | Tragic 81.1% |
| Immigrants | Micronesia | 0.0 /100 | #279 | Tragic 81.1% |
| Immigrants | Latin America | 0.0 /100 | #280 | Tragic 81.0% |
| Immigrants | Grenada | 0.0 /100 | #281 | Tragic 81.0% |
| Aleuts | 0.0 /100 | #282 | Tragic 81.0% |
| French American Indians | 0.0 /100 | #283 | Tragic 80.8% |
| Belizeans | 0.0 /100 | #284 | Tragic 80.8% |