Guyanese vs Immigrants from Thailand In Labor Force | Age > 16
COMPARE
Guyanese
Immigrants from Thailand
In Labor Force | Age > 16
In Labor Force | Age > 16 Comparison
Guyanese
Immigrants from Thailand
64.1%
IN LABOR FORCE | AGE > 16
0.4/ 100
METRIC RATING
270th/ 347
METRIC RANK
65.7%
IN LABOR FORCE | AGE > 16
96.6/ 100
METRIC RATING
118th/ 347
METRIC RANK
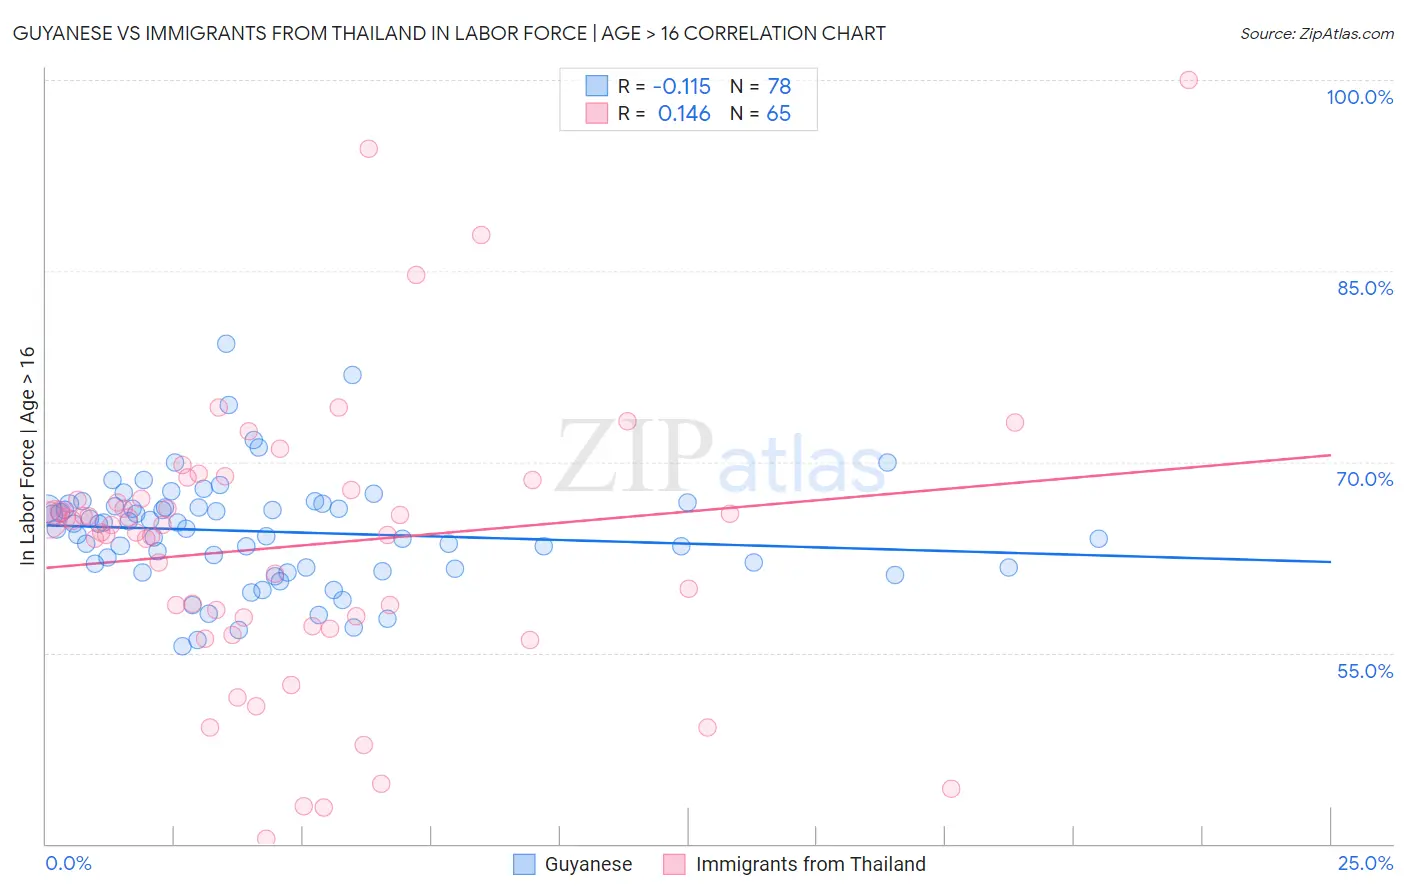
Guyanese vs Immigrants from Thailand In Labor Force | Age > 16 Correlation Chart
The statistical analysis conducted on geographies consisting of 176,935,808 people shows a poor negative correlation between the proportion of Guyanese and labor force participation rate among population ages 16 and over in the United States with a correlation coefficient (R) of -0.115 and weighted average of 64.1%. Similarly, the statistical analysis conducted on geographies consisting of 317,023,360 people shows a poor positive correlation between the proportion of Immigrants from Thailand and labor force participation rate among population ages 16 and over in the United States with a correlation coefficient (R) of 0.146 and weighted average of 65.7%, a difference of 2.5%.
In Labor Force | Age > 16 Correlation Summary
| Measurement | Guyanese | Immigrants from Thailand |
| Minimum | 55.5% | 40.4% |
| Maximum | 79.3% | 100.0% |
| Range | 23.8% | 59.6% |
| Mean | 64.5% | 63.4% |
| Median | 64.9% | 65.1% |
| Interquartile 25% (IQ1) | 61.7% | 57.4% |
| Interquartile 75% (IQ3) | 66.5% | 67.5% |
| Interquartile Range (IQR) | 4.8% | 10.1% |
| Standard Deviation (Sample) | 4.3% | 11.0% |
| Standard Deviation (Population) | 4.3% | 11.0% |
Similar Demographics by In Labor Force | Age > 16
Demographics Similar to Guyanese by In Labor Force | Age > 16
In terms of in labor force | age > 16, the demographic groups most similar to Guyanese are Dominican (64.1%, a difference of 0.0%), Irish (64.1%, a difference of 0.030%), Native Hawaiian (64.1%, a difference of 0.030%), Hmong (64.1%, a difference of 0.030%), and Immigrants from Cuba (64.1%, a difference of 0.050%).
| Demographics | Rating | Rank | In Labor Force | Age > 16 |
| Bahamians | 0.6 /100 | #263 | Tragic 64.2% |
| Dutch | 0.6 /100 | #264 | Tragic 64.2% |
| Cubans | 0.5 /100 | #265 | Tragic 64.2% |
| Immigrants | England | 0.5 /100 | #266 | Tragic 64.2% |
| Canadians | 0.5 /100 | #267 | Tragic 64.1% |
| Spaniards | 0.5 /100 | #268 | Tragic 64.1% |
| Irish | 0.4 /100 | #269 | Tragic 64.1% |
| Guyanese | 0.4 /100 | #270 | Tragic 64.1% |
| Dominicans | 0.4 /100 | #271 | Tragic 64.1% |
| Native Hawaiians | 0.3 /100 | #272 | Tragic 64.1% |
| Hmong | 0.3 /100 | #273 | Tragic 64.1% |
| Immigrants | Cuba | 0.3 /100 | #274 | Tragic 64.1% |
| Mexicans | 0.3 /100 | #275 | Tragic 64.1% |
| French American Indians | 0.3 /100 | #276 | Tragic 64.1% |
| Immigrants | Bahamas | 0.3 /100 | #277 | Tragic 64.0% |
Demographics Similar to Immigrants from Thailand by In Labor Force | Age > 16
In terms of in labor force | age > 16, the demographic groups most similar to Immigrants from Thailand are Immigrants from Iran (65.7%, a difference of 0.0%), Argentinean (65.7%, a difference of 0.010%), Immigrants from France (65.7%, a difference of 0.010%), Immigrants from Indonesia (65.7%, a difference of 0.020%), and Immigrants from Hong Kong (65.7%, a difference of 0.030%).
| Demographics | Rating | Rank | In Labor Force | Age > 16 |
| Immigrants | Honduras | 97.5 /100 | #111 | Exceptional 65.8% |
| Laotians | 97.4 /100 | #112 | Exceptional 65.8% |
| Pakistanis | 97.1 /100 | #113 | Exceptional 65.8% |
| Hondurans | 97.1 /100 | #114 | Exceptional 65.8% |
| Immigrants | Indonesia | 96.8 /100 | #115 | Exceptional 65.7% |
| Argentineans | 96.7 /100 | #116 | Exceptional 65.7% |
| Immigrants | Iran | 96.6 /100 | #117 | Exceptional 65.7% |
| Immigrants | Thailand | 96.6 /100 | #118 | Exceptional 65.7% |
| Immigrants | France | 96.4 /100 | #119 | Exceptional 65.7% |
| Immigrants | Hong Kong | 96.2 /100 | #120 | Exceptional 65.7% |
| New Zealanders | 96.0 /100 | #121 | Exceptional 65.7% |
| Immigrants | Ecuador | 95.9 /100 | #122 | Exceptional 65.7% |
| Immigrants | Iraq | 95.5 /100 | #123 | Exceptional 65.7% |
| Iraqis | 95.4 /100 | #124 | Exceptional 65.7% |
| Norwegians | 95.3 /100 | #125 | Exceptional 65.7% |