Guamanian/Chamorro vs Immigrants from Latin America In Labor Force | Age > 16
COMPARE
Guamanian/Chamorro
Immigrants from Latin America
In Labor Force | Age > 16
In Labor Force | Age > 16 Comparison
Guamanians/Chamorros
Immigrants from Latin America
65.6%
IN LABOR FORCE | AGE > 16
92.4/ 100
METRIC RATING
137th/ 347
METRIC RANK
64.8%
IN LABOR FORCE | AGE > 16
16.4/ 100
METRIC RATING
207th/ 347
METRIC RANK
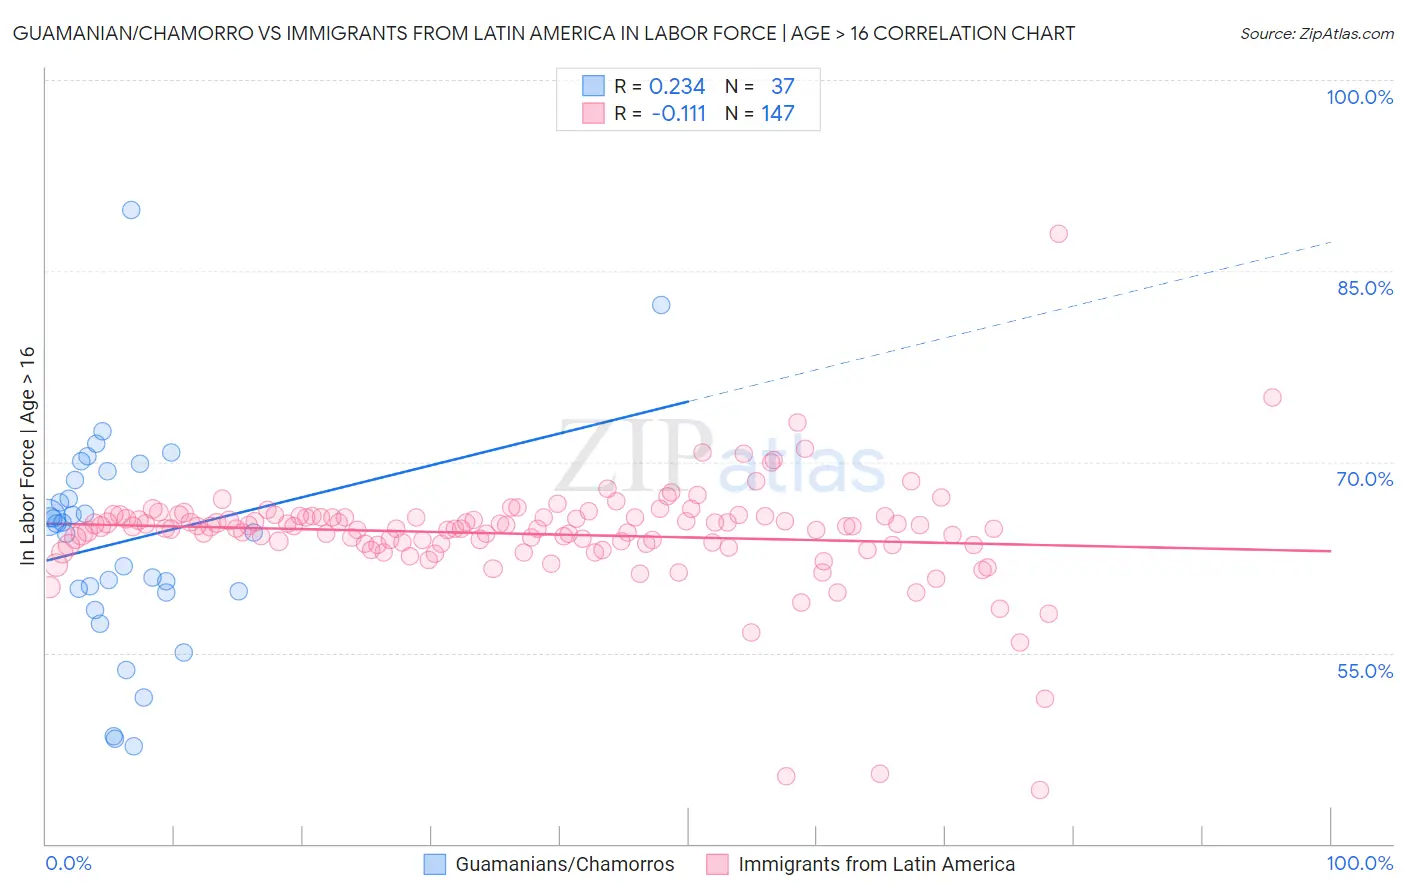
Guamanian/Chamorro vs Immigrants from Latin America In Labor Force | Age > 16 Correlation Chart
The statistical analysis conducted on geographies consisting of 221,958,282 people shows a weak positive correlation between the proportion of Guamanians/Chamorros and labor force participation rate among population ages 16 and over in the United States with a correlation coefficient (R) of 0.234 and weighted average of 65.6%. Similarly, the statistical analysis conducted on geographies consisting of 558,618,478 people shows a poor negative correlation between the proportion of Immigrants from Latin America and labor force participation rate among population ages 16 and over in the United States with a correlation coefficient (R) of -0.111 and weighted average of 64.8%, a difference of 1.2%.
In Labor Force | Age > 16 Correlation Summary
| Measurement | Guamanian/Chamorro | Immigrants from Latin America |
| Minimum | 47.6% | 44.2% |
| Maximum | 89.8% | 87.9% |
| Range | 42.2% | 43.7% |
| Mean | 63.8% | 64.3% |
| Median | 65.1% | 64.8% |
| Interquartile 25% (IQ1) | 59.8% | 63.5% |
| Interquartile 75% (IQ3) | 68.9% | 65.7% |
| Interquartile Range (IQR) | 9.2% | 2.2% |
| Standard Deviation (Sample) | 8.6% | 4.4% |
| Standard Deviation (Population) | 8.5% | 4.4% |
Similar Demographics by In Labor Force | Age > 16
Demographics Similar to Guamanians/Chamorros by In Labor Force | Age > 16
In terms of in labor force | age > 16, the demographic groups most similar to Guamanians/Chamorros are Guatemalan (65.6%, a difference of 0.0%), Immigrants from Argentina (65.6%, a difference of 0.0%), Immigrants from West Indies (65.6%, a difference of 0.010%), Costa Rican (65.6%, a difference of 0.040%), and Immigrants from Lithuania (65.6%, a difference of 0.050%).
| Demographics | Rating | Rank | In Labor Force | Age > 16 |
| Immigrants | Guatemala | 94.4 /100 | #130 | Exceptional 65.6% |
| Icelanders | 94.3 /100 | #131 | Exceptional 65.6% |
| Immigrants | North Macedonia | 94.1 /100 | #132 | Exceptional 65.6% |
| Immigrants | Lithuania | 93.5 /100 | #133 | Exceptional 65.6% |
| Costa Ricans | 93.2 /100 | #134 | Exceptional 65.6% |
| Guatemalans | 92.5 /100 | #135 | Exceptional 65.6% |
| Immigrants | Argentina | 92.4 /100 | #136 | Exceptional 65.6% |
| Guamanians/Chamorros | 92.4 /100 | #137 | Exceptional 65.6% |
| Immigrants | West Indies | 92.0 /100 | #138 | Exceptional 65.6% |
| Immigrants | Taiwan | 90.8 /100 | #139 | Exceptional 65.5% |
| Immigrants | Costa Rica | 90.8 /100 | #140 | Exceptional 65.5% |
| Samoans | 90.5 /100 | #141 | Exceptional 65.5% |
| Indians (Asian) | 89.5 /100 | #142 | Excellent 65.5% |
| Latvians | 89.4 /100 | #143 | Excellent 65.5% |
| Immigrants | Romania | 88.6 /100 | #144 | Excellent 65.5% |
Demographics Similar to Immigrants from Latin America by In Labor Force | Age > 16
In terms of in labor force | age > 16, the demographic groups most similar to Immigrants from Latin America are Belizean (64.8%, a difference of 0.010%), Lithuanian (64.8%, a difference of 0.020%), Immigrants from Trinidad and Tobago (64.8%, a difference of 0.020%), Slovene (64.9%, a difference of 0.040%), and Jamaican (64.9%, a difference of 0.040%).
| Demographics | Rating | Rank | In Labor Force | Age > 16 |
| Armenians | 20.2 /100 | #200 | Fair 64.9% |
| Ukrainians | 19.6 /100 | #201 | Poor 64.9% |
| Immigrants | Belgium | 19.4 /100 | #202 | Poor 64.9% |
| Russians | 18.8 /100 | #203 | Poor 64.9% |
| Slovenes | 18.7 /100 | #204 | Poor 64.9% |
| Jamaicans | 18.7 /100 | #205 | Poor 64.9% |
| Lithuanians | 17.4 /100 | #206 | Poor 64.8% |
| Immigrants | Latin America | 16.4 /100 | #207 | Poor 64.8% |
| Belizeans | 16.2 /100 | #208 | Poor 64.8% |
| Immigrants | Trinidad and Tobago | 15.6 /100 | #209 | Poor 64.8% |
| Immigrants | Denmark | 14.7 /100 | #210 | Poor 64.8% |
| Fijians | 14.1 /100 | #211 | Poor 64.8% |
| Alaskan Athabascans | 13.9 /100 | #212 | Poor 64.8% |
| Maltese | 13.8 /100 | #213 | Poor 64.8% |
| Estonians | 13.1 /100 | #214 | Poor 64.8% |