Blackfeet vs Immigrants from Latin America In Labor Force | Age > 16
COMPARE
Blackfeet
Immigrants from Latin America
In Labor Force | Age > 16
In Labor Force | Age > 16 Comparison
Blackfeet
Immigrants from Latin America
63.2%
IN LABOR FORCE | AGE > 16
0.0/ 100
METRIC RATING
311th/ 347
METRIC RANK
64.8%
IN LABOR FORCE | AGE > 16
16.4/ 100
METRIC RATING
207th/ 347
METRIC RANK
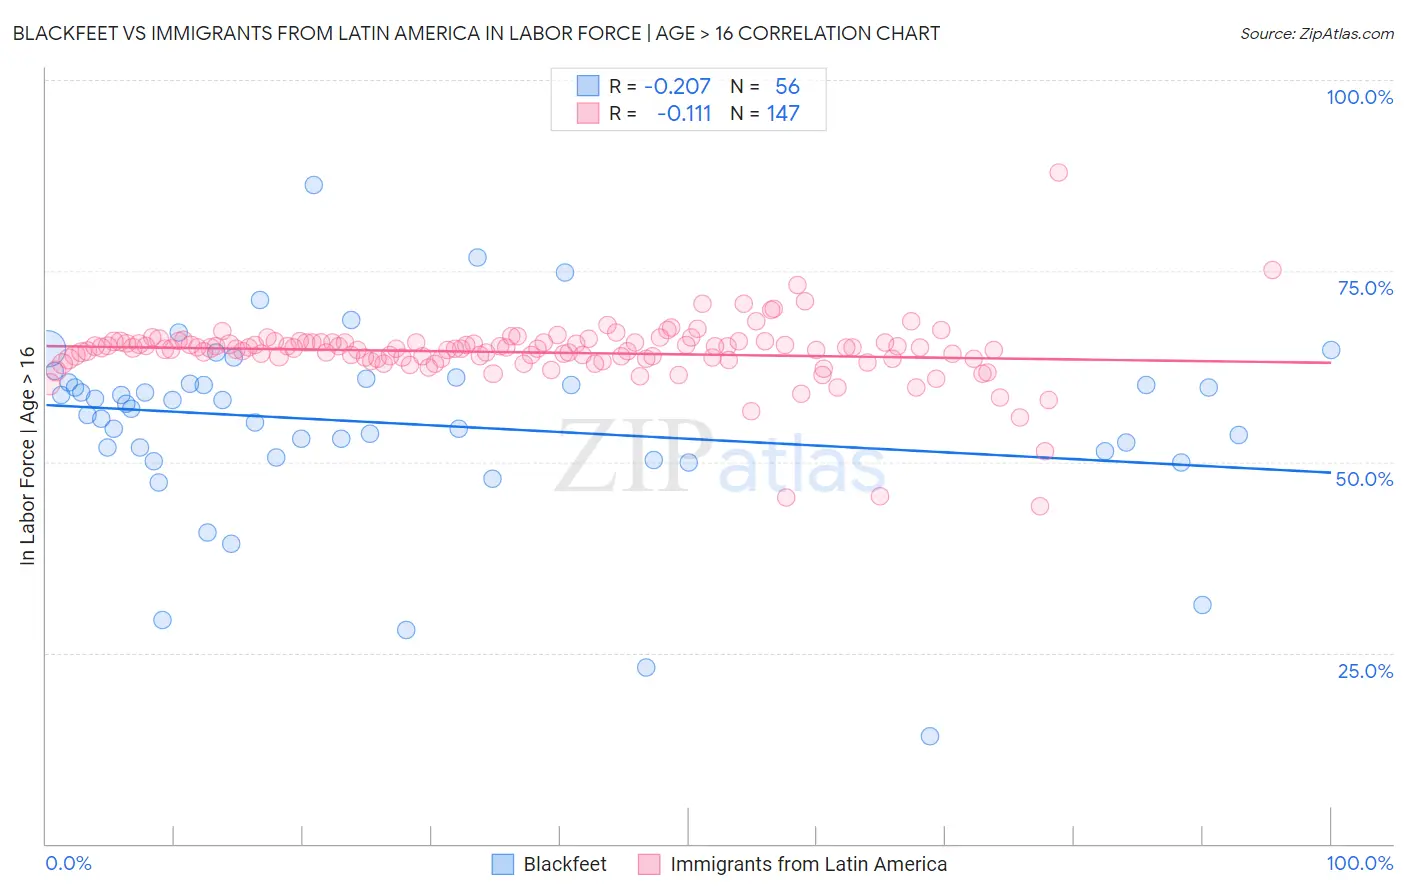
Blackfeet vs Immigrants from Latin America In Labor Force | Age > 16 Correlation Chart
The statistical analysis conducted on geographies consisting of 309,565,086 people shows a weak negative correlation between the proportion of Blackfeet and labor force participation rate among population ages 16 and over in the United States with a correlation coefficient (R) of -0.207 and weighted average of 63.2%. Similarly, the statistical analysis conducted on geographies consisting of 558,618,478 people shows a poor negative correlation between the proportion of Immigrants from Latin America and labor force participation rate among population ages 16 and over in the United States with a correlation coefficient (R) of -0.111 and weighted average of 64.8%, a difference of 2.5%.
In Labor Force | Age > 16 Correlation Summary
| Measurement | Blackfeet | Immigrants from Latin America |
| Minimum | 14.1% | 44.2% |
| Maximum | 86.2% | 87.9% |
| Range | 72.1% | 43.7% |
| Mean | 55.0% | 64.3% |
| Median | 57.3% | 64.8% |
| Interquartile 25% (IQ1) | 51.0% | 63.5% |
| Interquartile 75% (IQ3) | 60.3% | 65.7% |
| Interquartile Range (IQR) | 9.3% | 2.2% |
| Standard Deviation (Sample) | 12.5% | 4.4% |
| Standard Deviation (Population) | 12.4% | 4.4% |
Similar Demographics by In Labor Force | Age > 16
Demographics Similar to Blackfeet by In Labor Force | Age > 16
In terms of in labor force | age > 16, the demographic groups most similar to Blackfeet are Shoshone (63.2%, a difference of 0.010%), Iroquois (63.2%, a difference of 0.060%), Scotch-Irish (63.3%, a difference of 0.080%), Chippewa (63.1%, a difference of 0.19%), and Pennsylvania German (63.4%, a difference of 0.21%).
| Demographics | Rating | Rank | In Labor Force | Age > 16 |
| Immigrants | Nonimmigrants | 0.0 /100 | #304 | Tragic 63.5% |
| Osage | 0.0 /100 | #305 | Tragic 63.5% |
| Blacks/African Americans | 0.0 /100 | #306 | Tragic 63.4% |
| Central American Indians | 0.0 /100 | #307 | Tragic 63.4% |
| Pennsylvania Germans | 0.0 /100 | #308 | Tragic 63.4% |
| Scotch-Irish | 0.0 /100 | #309 | Tragic 63.3% |
| Shoshone | 0.0 /100 | #310 | Tragic 63.2% |
| Blackfeet | 0.0 /100 | #311 | Tragic 63.2% |
| Iroquois | 0.0 /100 | #312 | Tragic 63.2% |
| Chippewa | 0.0 /100 | #313 | Tragic 63.1% |
| Yaqui | 0.0 /100 | #314 | Tragic 63.0% |
| Potawatomi | 0.0 /100 | #315 | Tragic 62.8% |
| Yup'ik | 0.0 /100 | #316 | Tragic 62.7% |
| Kiowa | 0.0 /100 | #317 | Tragic 62.4% |
| Chickasaw | 0.0 /100 | #318 | Tragic 62.3% |
Demographics Similar to Immigrants from Latin America by In Labor Force | Age > 16
In terms of in labor force | age > 16, the demographic groups most similar to Immigrants from Latin America are Belizean (64.8%, a difference of 0.010%), Lithuanian (64.8%, a difference of 0.020%), Immigrants from Trinidad and Tobago (64.8%, a difference of 0.020%), Slovene (64.9%, a difference of 0.040%), and Jamaican (64.9%, a difference of 0.040%).
| Demographics | Rating | Rank | In Labor Force | Age > 16 |
| Armenians | 20.2 /100 | #200 | Fair 64.9% |
| Ukrainians | 19.6 /100 | #201 | Poor 64.9% |
| Immigrants | Belgium | 19.4 /100 | #202 | Poor 64.9% |
| Russians | 18.8 /100 | #203 | Poor 64.9% |
| Slovenes | 18.7 /100 | #204 | Poor 64.9% |
| Jamaicans | 18.7 /100 | #205 | Poor 64.9% |
| Lithuanians | 17.4 /100 | #206 | Poor 64.8% |
| Immigrants | Latin America | 16.4 /100 | #207 | Poor 64.8% |
| Belizeans | 16.2 /100 | #208 | Poor 64.8% |
| Immigrants | Trinidad and Tobago | 15.6 /100 | #209 | Poor 64.8% |
| Immigrants | Denmark | 14.7 /100 | #210 | Poor 64.8% |
| Fijians | 14.1 /100 | #211 | Poor 64.8% |
| Alaskan Athabascans | 13.9 /100 | #212 | Poor 64.8% |
| Maltese | 13.8 /100 | #213 | Poor 64.8% |
| Estonians | 13.1 /100 | #214 | Poor 64.8% |