Immigrants from Northern Europe vs Immigrants from Latin America In Labor Force | Age > 16
COMPARE
Immigrants from Northern Europe
Immigrants from Latin America
In Labor Force | Age > 16
In Labor Force | Age > 16 Comparison
Immigrants from Northern Europe
Immigrants from Latin America
64.7%
IN LABOR FORCE | AGE > 16
7.2/ 100
METRIC RATING
231st/ 347
METRIC RANK
64.8%
IN LABOR FORCE | AGE > 16
16.4/ 100
METRIC RATING
207th/ 347
METRIC RANK
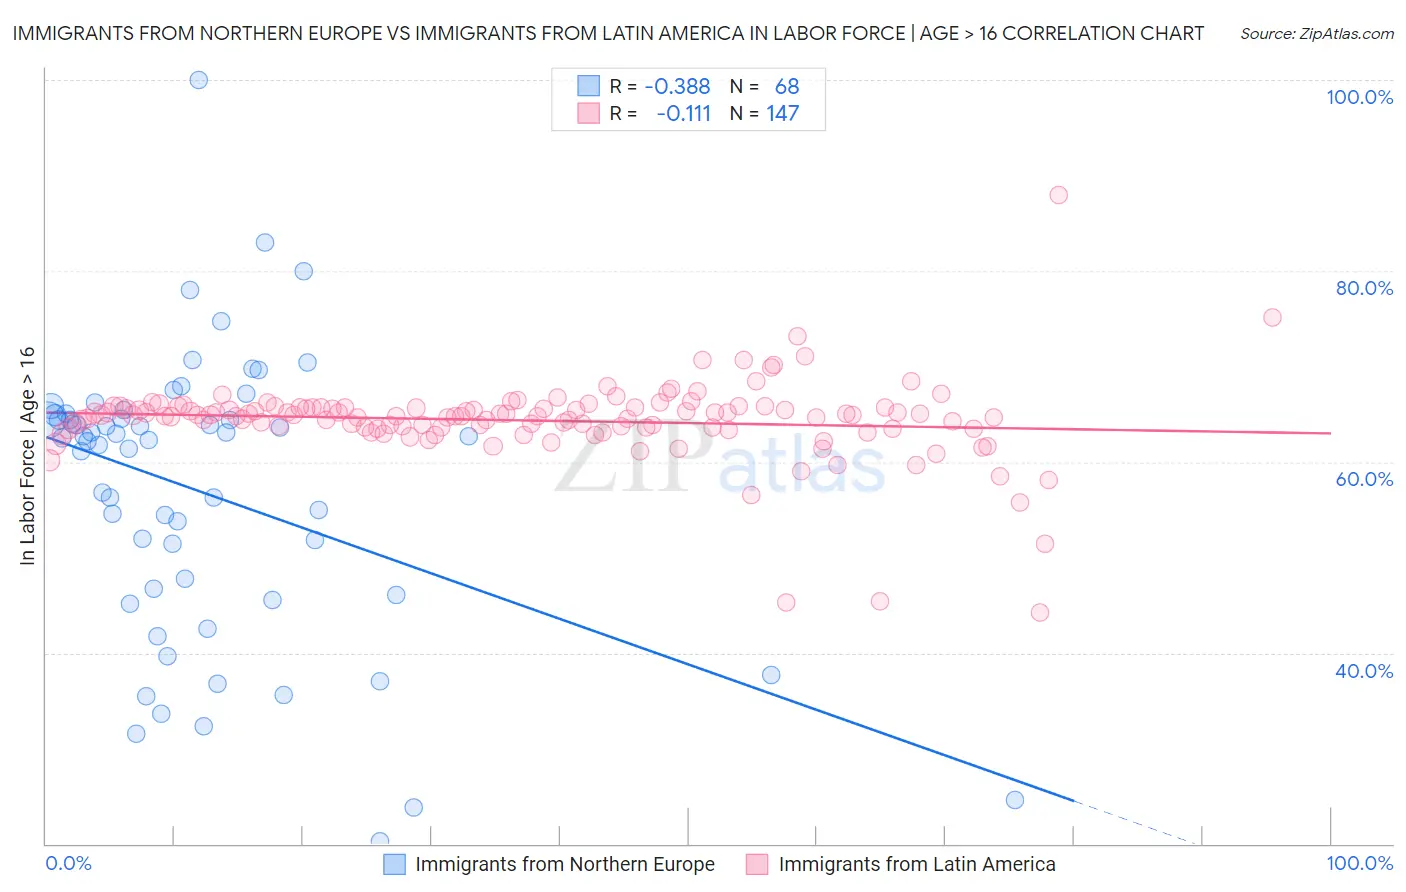
Immigrants from Northern Europe vs Immigrants from Latin America In Labor Force | Age > 16 Correlation Chart
The statistical analysis conducted on geographies consisting of 477,244,389 people shows a mild negative correlation between the proportion of Immigrants from Northern Europe and labor force participation rate among population ages 16 and over in the United States with a correlation coefficient (R) of -0.388 and weighted average of 64.7%. Similarly, the statistical analysis conducted on geographies consisting of 558,618,478 people shows a poor negative correlation between the proportion of Immigrants from Latin America and labor force participation rate among population ages 16 and over in the United States with a correlation coefficient (R) of -0.111 and weighted average of 64.8%, a difference of 0.26%.
In Labor Force | Age > 16 Correlation Summary
| Measurement | Immigrants from Northern Europe | Immigrants from Latin America |
| Minimum | 20.3% | 44.2% |
| Maximum | 100.0% | 87.9% |
| Range | 79.7% | 43.7% |
| Mean | 56.8% | 64.3% |
| Median | 62.4% | 64.8% |
| Interquartile 25% (IQ1) | 46.4% | 63.5% |
| Interquartile 75% (IQ3) | 64.7% | 65.7% |
| Interquartile Range (IQR) | 18.3% | 2.2% |
| Standard Deviation (Sample) | 14.9% | 4.4% |
| Standard Deviation (Population) | 14.8% | 4.4% |
Similar Demographics by In Labor Force | Age > 16
Demographics Similar to Immigrants from Northern Europe by In Labor Force | Age > 16
In terms of in labor force | age > 16, the demographic groups most similar to Immigrants from Northern Europe are British (64.7%, a difference of 0.0%), Chinese (64.7%, a difference of 0.0%), European (64.7%, a difference of 0.040%), Polish (64.7%, a difference of 0.040%), and Northern European (64.7%, a difference of 0.040%).
| Demographics | Rating | Rank | In Labor Force | Age > 16 |
| Immigrants | Jamaica | 8.8 /100 | #224 | Tragic 64.7% |
| Croatians | 8.8 /100 | #225 | Tragic 64.7% |
| Europeans | 8.3 /100 | #226 | Tragic 64.7% |
| Poles | 8.3 /100 | #227 | Tragic 64.7% |
| Northern Europeans | 8.2 /100 | #228 | Tragic 64.7% |
| British | 7.3 /100 | #229 | Tragic 64.7% |
| Chinese | 7.3 /100 | #230 | Tragic 64.7% |
| Immigrants | Northern Europe | 7.2 /100 | #231 | Tragic 64.7% |
| Africans | 5.8 /100 | #232 | Tragic 64.6% |
| Slavs | 4.9 /100 | #233 | Tragic 64.6% |
| Vietnamese | 4.7 /100 | #234 | Tragic 64.6% |
| Austrians | 4.6 /100 | #235 | Tragic 64.6% |
| Immigrants | Norway | 4.6 /100 | #236 | Tragic 64.6% |
| Italians | 4.6 /100 | #237 | Tragic 64.6% |
| Lebanese | 3.9 /100 | #238 | Tragic 64.5% |
Demographics Similar to Immigrants from Latin America by In Labor Force | Age > 16
In terms of in labor force | age > 16, the demographic groups most similar to Immigrants from Latin America are Belizean (64.8%, a difference of 0.010%), Lithuanian (64.8%, a difference of 0.020%), Immigrants from Trinidad and Tobago (64.8%, a difference of 0.020%), Slovene (64.9%, a difference of 0.040%), and Jamaican (64.9%, a difference of 0.040%).
| Demographics | Rating | Rank | In Labor Force | Age > 16 |
| Armenians | 20.2 /100 | #200 | Fair 64.9% |
| Ukrainians | 19.6 /100 | #201 | Poor 64.9% |
| Immigrants | Belgium | 19.4 /100 | #202 | Poor 64.9% |
| Russians | 18.8 /100 | #203 | Poor 64.9% |
| Slovenes | 18.7 /100 | #204 | Poor 64.9% |
| Jamaicans | 18.7 /100 | #205 | Poor 64.9% |
| Lithuanians | 17.4 /100 | #206 | Poor 64.8% |
| Immigrants | Latin America | 16.4 /100 | #207 | Poor 64.8% |
| Belizeans | 16.2 /100 | #208 | Poor 64.8% |
| Immigrants | Trinidad and Tobago | 15.6 /100 | #209 | Poor 64.8% |
| Immigrants | Denmark | 14.7 /100 | #210 | Poor 64.8% |
| Fijians | 14.1 /100 | #211 | Poor 64.8% |
| Alaskan Athabascans | 13.9 /100 | #212 | Poor 64.8% |
| Maltese | 13.8 /100 | #213 | Poor 64.8% |
| Estonians | 13.1 /100 | #214 | Poor 64.8% |