Guamanian/Chamorro vs Immigrants from Latin America Divorced or Separated
COMPARE
Guamanian/Chamorro
Immigrants from Latin America
Divorced or Separated
Divorced or Separated Comparison
Guamanians/Chamorros
Immigrants from Latin America
12.3%
DIVORCED OR SEPARATED
11.3/ 100
METRIC RATING
221st/ 347
METRIC RANK
12.4%
DIVORCED OR SEPARATED
2.8/ 100
METRIC RATING
243rd/ 347
METRIC RANK
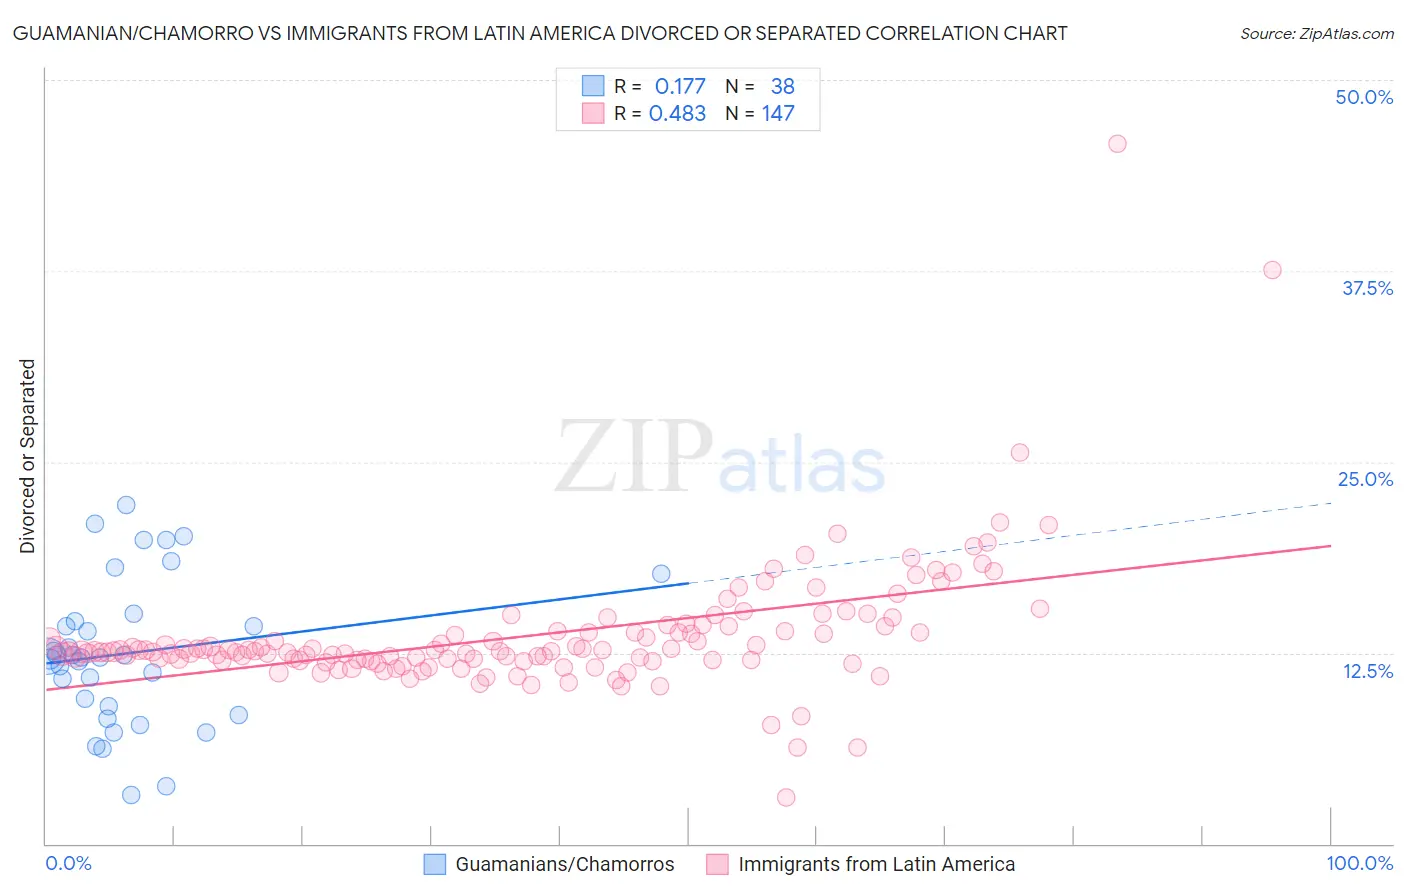
Guamanian/Chamorro vs Immigrants from Latin America Divorced or Separated Correlation Chart
The statistical analysis conducted on geographies consisting of 221,943,719 people shows a poor positive correlation between the proportion of Guamanians/Chamorros and percentage of population currently divorced or separated in the United States with a correlation coefficient (R) of 0.177 and weighted average of 12.3%. Similarly, the statistical analysis conducted on geographies consisting of 558,222,982 people shows a moderate positive correlation between the proportion of Immigrants from Latin America and percentage of population currently divorced or separated in the United States with a correlation coefficient (R) of 0.483 and weighted average of 12.4%, a difference of 1.3%.
Divorced or Separated Correlation Summary
| Measurement | Guamanian/Chamorro | Immigrants from Latin America |
| Minimum | 3.2% | 3.0% |
| Maximum | 22.2% | 45.8% |
| Range | 19.0% | 42.8% |
| Mean | 12.5% | 13.6% |
| Median | 12.2% | 12.6% |
| Interquartile 25% (IQ1) | 9.0% | 12.0% |
| Interquartile 75% (IQ3) | 14.6% | 13.9% |
| Interquartile Range (IQR) | 5.6% | 1.9% |
| Standard Deviation (Sample) | 4.7% | 4.3% |
| Standard Deviation (Population) | 4.7% | 4.3% |
Similar Demographics by Divorced or Separated
Demographics Similar to Guamanians/Chamorros by Divorced or Separated
In terms of divorced or separated, the demographic groups most similar to Guamanians/Chamorros are Czechoslovakian (12.3%, a difference of 0.030%), British (12.3%, a difference of 0.030%), Bangladeshi (12.3%, a difference of 0.070%), Scandinavian (12.3%, a difference of 0.080%), and Slovene (12.3%, a difference of 0.15%).
| Demographics | Rating | Rank | Divorced or Separated |
| Immigrants | Argentina | 15.5 /100 | #214 | Poor 12.2% |
| Europeans | 15.4 /100 | #215 | Poor 12.2% |
| Immigrants | South America | 15.4 /100 | #216 | Poor 12.2% |
| Northern Europeans | 14.7 /100 | #217 | Poor 12.2% |
| Slovenes | 13.2 /100 | #218 | Poor 12.3% |
| Czechoslovakians | 11.7 /100 | #219 | Poor 12.3% |
| British | 11.6 /100 | #220 | Poor 12.3% |
| Guamanians/Chamorros | 11.3 /100 | #221 | Poor 12.3% |
| Bangladeshis | 10.5 /100 | #222 | Poor 12.3% |
| Scandinavians | 10.4 /100 | #223 | Poor 12.3% |
| Immigrants | Azores | 9.7 /100 | #224 | Tragic 12.3% |
| Belgians | 9.7 /100 | #225 | Tragic 12.3% |
| Immigrants | Western Africa | 9.3 /100 | #226 | Tragic 12.3% |
| Hmong | 8.8 /100 | #227 | Tragic 12.3% |
| Immigrants | Cameroon | 8.3 /100 | #228 | Tragic 12.3% |
Demographics Similar to Immigrants from Latin America by Divorced or Separated
In terms of divorced or separated, the demographic groups most similar to Immigrants from Latin America are Dutch (12.4%, a difference of 0.070%), Alaska Native (12.4%, a difference of 0.10%), Uruguayan (12.4%, a difference of 0.15%), British West Indian (12.4%, a difference of 0.24%), and Immigrants from Germany (12.4%, a difference of 0.29%).
| Demographics | Rating | Rank | Divorced or Separated |
| Colombians | 4.2 /100 | #236 | Tragic 12.4% |
| Immigrants | Laos | 4.2 /100 | #237 | Tragic 12.4% |
| Sudanese | 4.0 /100 | #238 | Tragic 12.4% |
| Immigrants | Germany | 4.0 /100 | #239 | Tragic 12.4% |
| British West Indians | 3.7 /100 | #240 | Tragic 12.4% |
| Uruguayans | 3.4 /100 | #241 | Tragic 12.4% |
| Dutch | 3.1 /100 | #242 | Tragic 12.4% |
| Immigrants | Latin America | 2.8 /100 | #243 | Tragic 12.4% |
| Alaska Natives | 2.5 /100 | #244 | Tragic 12.4% |
| Hispanics or Latinos | 2.0 /100 | #245 | Tragic 12.5% |
| Immigrants | West Indies | 1.9 /100 | #246 | Tragic 12.5% |
| Germans | 1.8 /100 | #247 | Tragic 12.5% |
| Nepalese | 1.8 /100 | #248 | Tragic 12.5% |
| Finns | 1.8 /100 | #249 | Tragic 12.5% |
| Irish | 1.3 /100 | #250 | Tragic 12.5% |