Sioux vs Immigrants from Latin America In Labor Force | Age > 16
COMPARE
Sioux
Immigrants from Latin America
In Labor Force | Age > 16
In Labor Force | Age > 16 Comparison
Sioux
Immigrants from Latin America
61.8%
IN LABOR FORCE | AGE > 16
0.0/ 100
METRIC RATING
326th/ 347
METRIC RANK
64.8%
IN LABOR FORCE | AGE > 16
16.4/ 100
METRIC RATING
207th/ 347
METRIC RANK
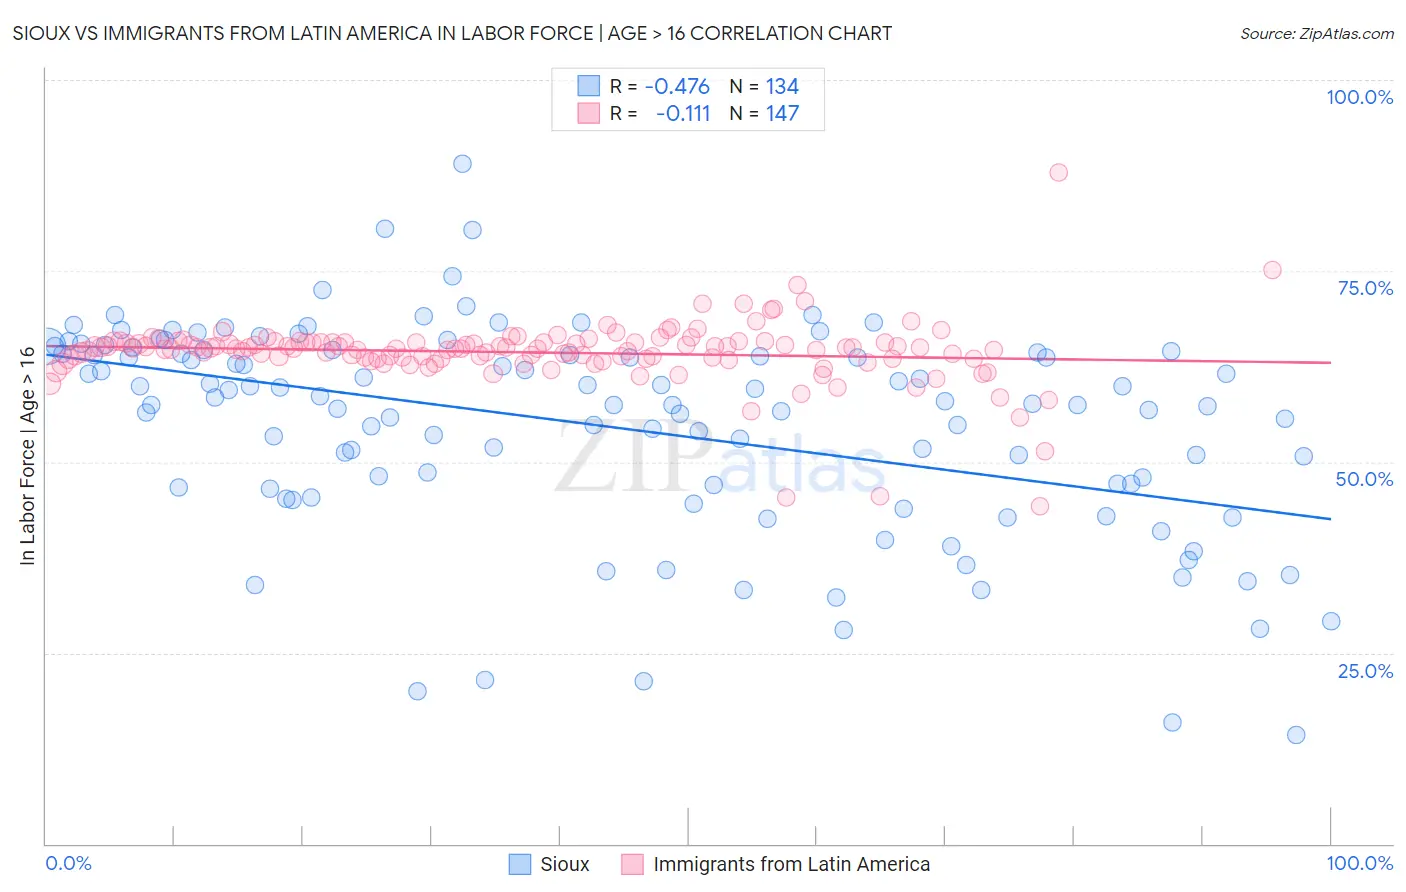
Sioux vs Immigrants from Latin America In Labor Force | Age > 16 Correlation Chart
The statistical analysis conducted on geographies consisting of 234,180,906 people shows a moderate negative correlation between the proportion of Sioux and labor force participation rate among population ages 16 and over in the United States with a correlation coefficient (R) of -0.476 and weighted average of 61.8%. Similarly, the statistical analysis conducted on geographies consisting of 558,618,478 people shows a poor negative correlation between the proportion of Immigrants from Latin America and labor force participation rate among population ages 16 and over in the United States with a correlation coefficient (R) of -0.111 and weighted average of 64.8%, a difference of 4.8%.
In Labor Force | Age > 16 Correlation Summary
| Measurement | Sioux | Immigrants from Latin America |
| Minimum | 14.3% | 44.2% |
| Maximum | 89.1% | 87.9% |
| Range | 74.8% | 43.7% |
| Mean | 54.7% | 64.3% |
| Median | 57.6% | 64.8% |
| Interquartile 25% (IQ1) | 46.6% | 63.5% |
| Interquartile 75% (IQ3) | 64.3% | 65.7% |
| Interquartile Range (IQR) | 17.7% | 2.2% |
| Standard Deviation (Sample) | 13.6% | 4.4% |
| Standard Deviation (Population) | 13.6% | 4.4% |
Similar Demographics by In Labor Force | Age > 16
Demographics Similar to Sioux by In Labor Force | Age > 16
In terms of in labor force | age > 16, the demographic groups most similar to Sioux are Cajun (61.8%, a difference of 0.11%), Cherokee (61.9%, a difference of 0.17%), Cheyenne (62.0%, a difference of 0.22%), Seminole (62.0%, a difference of 0.26%), and Dutch West Indian (61.7%, a difference of 0.27%).
| Demographics | Rating | Rank | In Labor Force | Age > 16 |
| Arapaho | 0.0 /100 | #319 | Tragic 62.1% |
| Yakama | 0.0 /100 | #320 | Tragic 62.1% |
| Americans | 0.0 /100 | #321 | Tragic 62.1% |
| Ottawa | 0.0 /100 | #322 | Tragic 62.0% |
| Seminole | 0.0 /100 | #323 | Tragic 62.0% |
| Cheyenne | 0.0 /100 | #324 | Tragic 62.0% |
| Cherokee | 0.0 /100 | #325 | Tragic 61.9% |
| Sioux | 0.0 /100 | #326 | Tragic 61.8% |
| Cajuns | 0.0 /100 | #327 | Tragic 61.8% |
| Dutch West Indians | 0.0 /100 | #328 | Tragic 61.7% |
| Choctaw | 0.0 /100 | #329 | Tragic 61.5% |
| Creek | 0.0 /100 | #330 | Tragic 61.3% |
| Ute | 0.0 /100 | #331 | Tragic 60.9% |
| Crow | 0.0 /100 | #332 | Tragic 60.8% |
| Paiute | 0.0 /100 | #333 | Tragic 60.7% |
Demographics Similar to Immigrants from Latin America by In Labor Force | Age > 16
In terms of in labor force | age > 16, the demographic groups most similar to Immigrants from Latin America are Belizean (64.8%, a difference of 0.010%), Lithuanian (64.8%, a difference of 0.020%), Immigrants from Trinidad and Tobago (64.8%, a difference of 0.020%), Slovene (64.9%, a difference of 0.040%), and Jamaican (64.9%, a difference of 0.040%).
| Demographics | Rating | Rank | In Labor Force | Age > 16 |
| Armenians | 20.2 /100 | #200 | Fair 64.9% |
| Ukrainians | 19.6 /100 | #201 | Poor 64.9% |
| Immigrants | Belgium | 19.4 /100 | #202 | Poor 64.9% |
| Russians | 18.8 /100 | #203 | Poor 64.9% |
| Slovenes | 18.7 /100 | #204 | Poor 64.9% |
| Jamaicans | 18.7 /100 | #205 | Poor 64.9% |
| Lithuanians | 17.4 /100 | #206 | Poor 64.8% |
| Immigrants | Latin America | 16.4 /100 | #207 | Poor 64.8% |
| Belizeans | 16.2 /100 | #208 | Poor 64.8% |
| Immigrants | Trinidad and Tobago | 15.6 /100 | #209 | Poor 64.8% |
| Immigrants | Denmark | 14.7 /100 | #210 | Poor 64.8% |
| Fijians | 14.1 /100 | #211 | Poor 64.8% |
| Alaskan Athabascans | 13.9 /100 | #212 | Poor 64.8% |
| Maltese | 13.8 /100 | #213 | Poor 64.8% |
| Estonians | 13.1 /100 | #214 | Poor 64.8% |