Greek vs Immigrants from Trinidad and Tobago In Labor Force | Age 25-29
COMPARE
Greek
Immigrants from Trinidad and Tobago
In Labor Force | Age 25-29
In Labor Force | Age 25-29 Comparison
Greeks
Immigrants from Trinidad and Tobago
85.5%
IN LABOR FORCE | AGE 25-29
99.6/ 100
METRIC RATING
58th/ 347
METRIC RANK
83.7%
IN LABOR FORCE | AGE 25-29
0.2/ 100
METRIC RATING
253rd/ 347
METRIC RANK
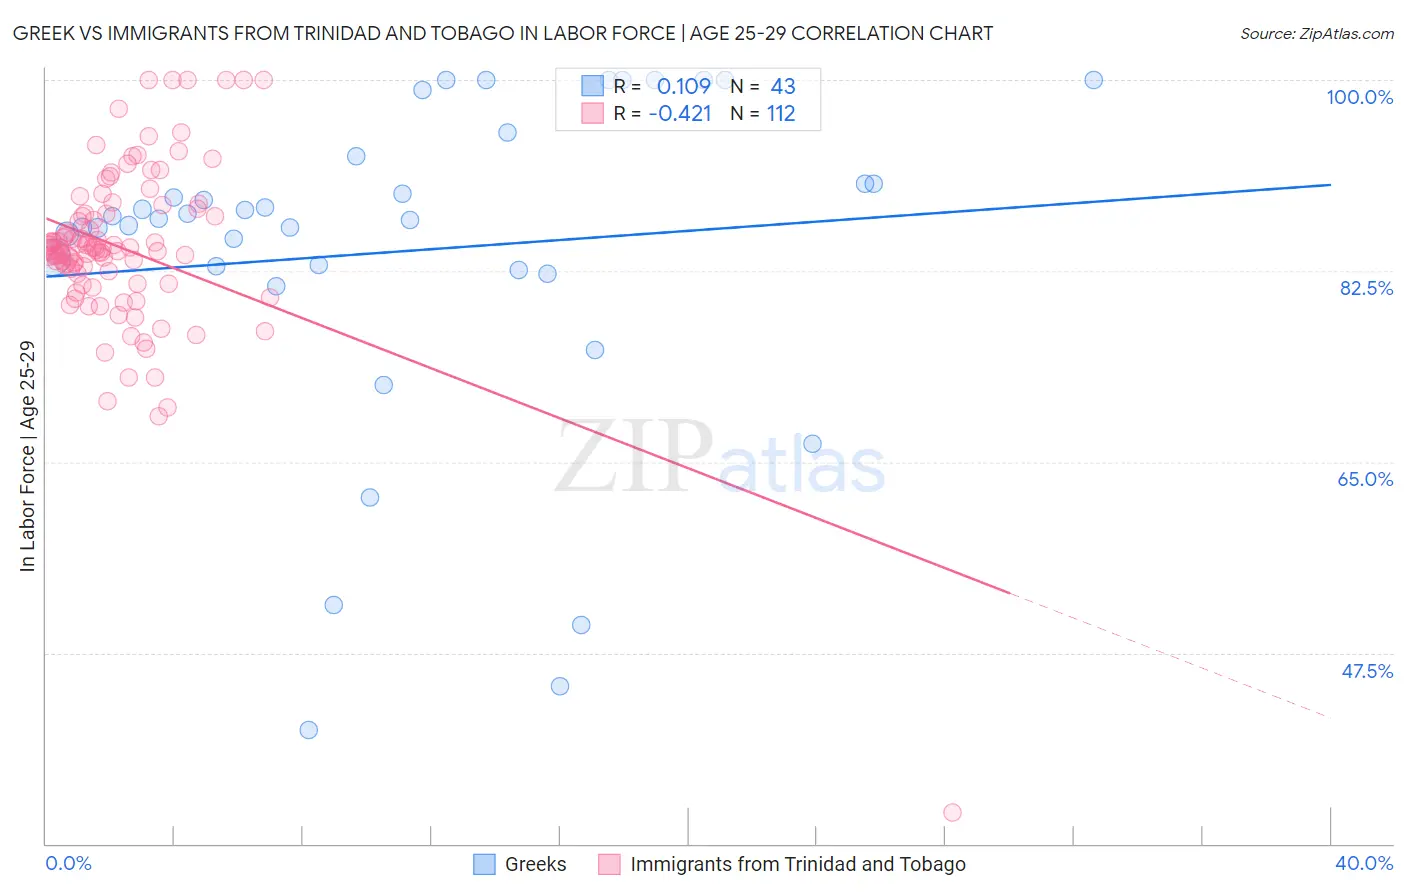
Greek vs Immigrants from Trinidad and Tobago In Labor Force | Age 25-29 Correlation Chart
The statistical analysis conducted on geographies consisting of 482,434,126 people shows a poor positive correlation between the proportion of Greeks and labor force participation rate among population between the ages 25 and 29 in the United States with a correlation coefficient (R) of 0.109 and weighted average of 85.5%. Similarly, the statistical analysis conducted on geographies consisting of 223,499,686 people shows a moderate negative correlation between the proportion of Immigrants from Trinidad and Tobago and labor force participation rate among population between the ages 25 and 29 in the United States with a correlation coefficient (R) of -0.421 and weighted average of 83.7%, a difference of 2.2%.
In Labor Force | Age 25-29 Correlation Summary
| Measurement | Greek | Immigrants from Trinidad and Tobago |
| Minimum | 40.4% | 32.9% |
| Maximum | 100.0% | 100.0% |
| Range | 59.6% | 67.1% |
| Mean | 84.3% | 84.6% |
| Median | 87.3% | 84.5% |
| Interquartile 25% (IQ1) | 82.6% | 82.3% |
| Interquartile 75% (IQ3) | 93.1% | 87.7% |
| Interquartile Range (IQR) | 10.5% | 5.4% |
| Standard Deviation (Sample) | 15.0% | 8.0% |
| Standard Deviation (Population) | 14.8% | 8.0% |
Similar Demographics by In Labor Force | Age 25-29
Demographics Similar to Greeks by In Labor Force | Age 25-29
In terms of in labor force | age 25-29, the demographic groups most similar to Greeks are Eastern European (85.5%, a difference of 0.010%), Estonian (85.5%, a difference of 0.010%), Immigrants from Morocco (85.5%, a difference of 0.010%), Thai (85.5%, a difference of 0.040%), and Serbian (85.5%, a difference of 0.040%).
| Demographics | Rating | Rank | In Labor Force | Age 25-29 |
| Immigrants | Latvia | 99.8 /100 | #51 | Exceptional 85.6% |
| Immigrants | Poland | 99.7 /100 | #52 | Exceptional 85.6% |
| Belgians | 99.7 /100 | #53 | Exceptional 85.5% |
| Albanians | 99.7 /100 | #54 | Exceptional 85.5% |
| Immigrants | Brazil | 99.7 /100 | #55 | Exceptional 85.5% |
| Eastern Europeans | 99.6 /100 | #56 | Exceptional 85.5% |
| Estonians | 99.6 /100 | #57 | Exceptional 85.5% |
| Greeks | 99.6 /100 | #58 | Exceptional 85.5% |
| Immigrants | Morocco | 99.5 /100 | #59 | Exceptional 85.5% |
| Thais | 99.5 /100 | #60 | Exceptional 85.5% |
| Serbians | 99.5 /100 | #61 | Exceptional 85.5% |
| Taiwanese | 99.4 /100 | #62 | Exceptional 85.4% |
| Immigrants | Kenya | 99.4 /100 | #63 | Exceptional 85.4% |
| Immigrants | Italy | 99.3 /100 | #64 | Exceptional 85.4% |
| Immigrants | Czechoslovakia | 99.3 /100 | #65 | Exceptional 85.4% |
Demographics Similar to Immigrants from Trinidad and Tobago by In Labor Force | Age 25-29
In terms of in labor force | age 25-29, the demographic groups most similar to Immigrants from Trinidad and Tobago are Guatemalan (83.7%, a difference of 0.0%), Spaniard (83.7%, a difference of 0.0%), Bahamian (83.7%, a difference of 0.010%), Haitian (83.7%, a difference of 0.010%), and Immigrants from Haiti (83.7%, a difference of 0.020%).
| Demographics | Rating | Rank | In Labor Force | Age 25-29 |
| Cree | 0.3 /100 | #246 | Tragic 83.8% |
| Immigrants | El Salvador | 0.3 /100 | #247 | Tragic 83.7% |
| Immigrants | Nonimmigrants | 0.3 /100 | #248 | Tragic 83.7% |
| Hmong | 0.3 /100 | #249 | Tragic 83.7% |
| Central Americans | 0.2 /100 | #250 | Tragic 83.7% |
| Bahamians | 0.2 /100 | #251 | Tragic 83.7% |
| Guatemalans | 0.2 /100 | #252 | Tragic 83.7% |
| Immigrants | Trinidad and Tobago | 0.2 /100 | #253 | Tragic 83.7% |
| Spaniards | 0.2 /100 | #254 | Tragic 83.7% |
| Haitians | 0.2 /100 | #255 | Tragic 83.7% |
| Immigrants | Haiti | 0.2 /100 | #256 | Tragic 83.7% |
| Delaware | 0.2 /100 | #257 | Tragic 83.7% |
| Immigrants | Guatemala | 0.1 /100 | #258 | Tragic 83.6% |
| Spanish | 0.1 /100 | #259 | Tragic 83.6% |
| Immigrants | Bahamas | 0.1 /100 | #260 | Tragic 83.6% |