Greek vs Immigrants from Hong Kong 10th Grade
COMPARE
Greek
Immigrants from Hong Kong
10th Grade
10th Grade Comparison
Greeks
Immigrants from Hong Kong
95.2%
10TH GRADE
99.9/ 100
METRIC RATING
45th/ 347
METRIC RANK
93.1%
10TH GRADE
4.2/ 100
METRIC RATING
240th/ 347
METRIC RANK
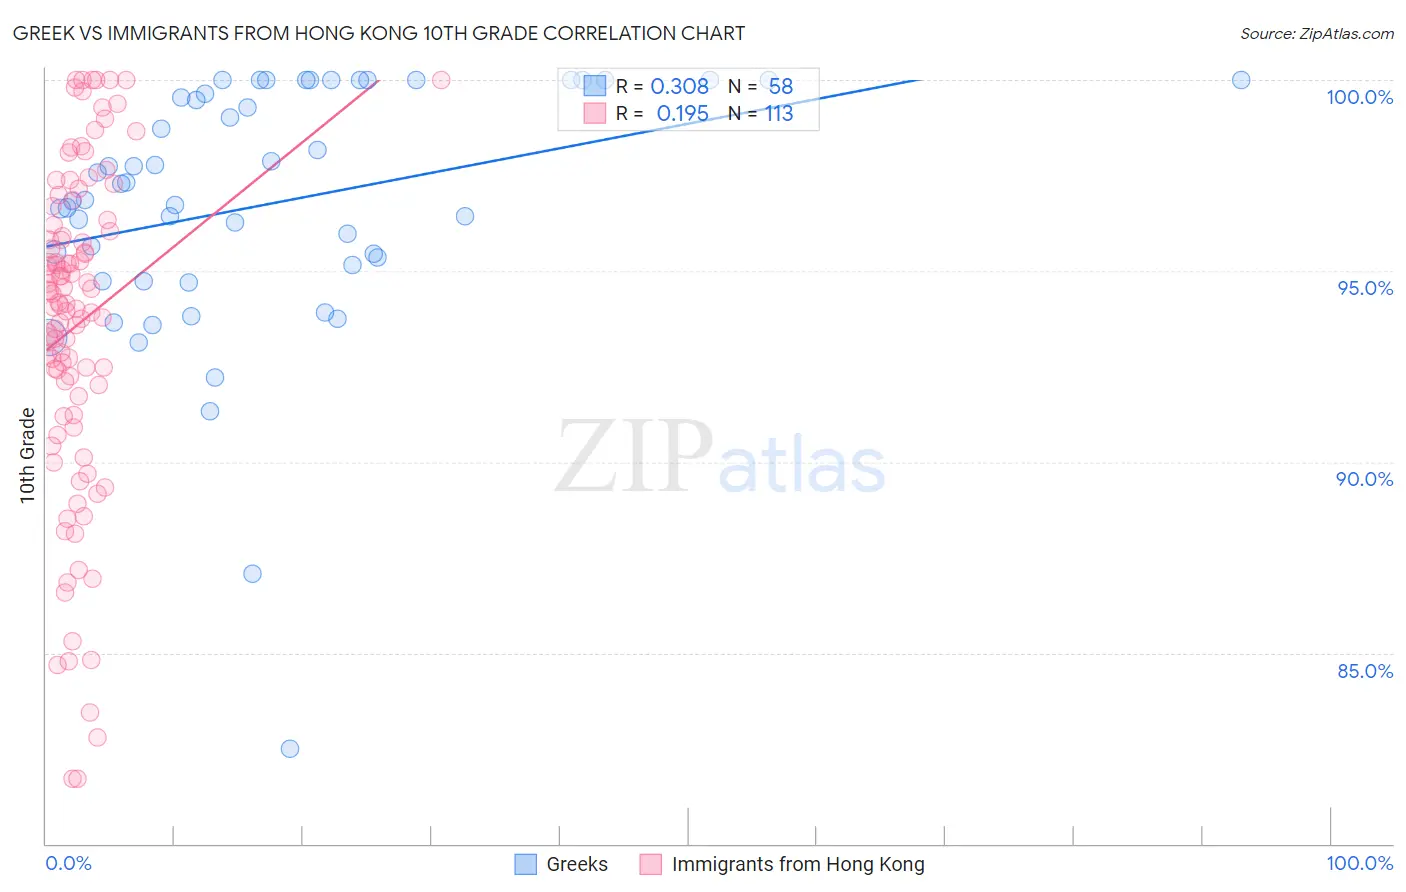
Greek vs Immigrants from Hong Kong 10th Grade Correlation Chart
The statistical analysis conducted on geographies consisting of 482,775,358 people shows a mild positive correlation between the proportion of Greeks and percentage of population with at least 10th grade education in the United States with a correlation coefficient (R) of 0.308 and weighted average of 95.2%. Similarly, the statistical analysis conducted on geographies consisting of 253,990,382 people shows a poor positive correlation between the proportion of Immigrants from Hong Kong and percentage of population with at least 10th grade education in the United States with a correlation coefficient (R) of 0.195 and weighted average of 93.1%, a difference of 2.2%.
10th Grade Correlation Summary
| Measurement | Greek | Immigrants from Hong Kong |
| Minimum | 82.5% | 81.7% |
| Maximum | 100.0% | 100.0% |
| Range | 17.5% | 18.3% |
| Mean | 96.8% | 93.6% |
| Median | 97.1% | 94.2% |
| Interquartile 25% (IQ1) | 95.2% | 91.5% |
| Interquartile 75% (IQ3) | 100.0% | 96.3% |
| Interquartile Range (IQR) | 4.8% | 4.8% |
| Standard Deviation (Sample) | 3.4% | 4.3% |
| Standard Deviation (Population) | 3.3% | 4.3% |
Similar Demographics by 10th Grade
Demographics Similar to Greeks by 10th Grade
In terms of 10th grade, the demographic groups most similar to Greeks are Immigrants from Northern Europe (95.2%, a difference of 0.0%), Macedonian (95.2%, a difference of 0.010%), Czechoslovakian (95.1%, a difference of 0.010%), Serbian (95.1%, a difference of 0.020%), and Slavic (95.2%, a difference of 0.030%).
| Demographics | Rating | Rank | 10th Grade |
| Northern Europeans | 99.9 /100 | #38 | Exceptional 95.3% |
| Immigrants | Scotland | 99.9 /100 | #39 | Exceptional 95.2% |
| Scotch-Irish | 99.9 /100 | #40 | Exceptional 95.2% |
| Russians | 99.9 /100 | #41 | Exceptional 95.2% |
| Slavs | 99.9 /100 | #42 | Exceptional 95.2% |
| Macedonians | 99.9 /100 | #43 | Exceptional 95.2% |
| Immigrants | Northern Europe | 99.9 /100 | #44 | Exceptional 95.2% |
| Greeks | 99.9 /100 | #45 | Exceptional 95.2% |
| Czechoslovakians | 99.9 /100 | #46 | Exceptional 95.1% |
| Serbians | 99.9 /100 | #47 | Exceptional 95.1% |
| Australians | 99.9 /100 | #48 | Exceptional 95.1% |
| Immigrants | Austria | 99.9 /100 | #49 | Exceptional 95.1% |
| Immigrants | Canada | 99.8 /100 | #50 | Exceptional 95.1% |
| Austrians | 99.8 /100 | #51 | Exceptional 95.1% |
| Ottawa | 99.8 /100 | #52 | Exceptional 95.1% |
Demographics Similar to Immigrants from Hong Kong by 10th Grade
In terms of 10th grade, the demographic groups most similar to Immigrants from Hong Kong are Nigerian (93.1%, a difference of 0.0%), Costa Rican (93.1%, a difference of 0.0%), Immigrants from Panama (93.1%, a difference of 0.010%), African (93.1%, a difference of 0.020%), and Afghan (93.1%, a difference of 0.020%).
| Demographics | Rating | Rank | 10th Grade |
| Comanche | 4.9 /100 | #233 | Tragic 93.1% |
| Sub-Saharan Africans | 4.7 /100 | #234 | Tragic 93.1% |
| Africans | 4.6 /100 | #235 | Tragic 93.1% |
| Afghans | 4.5 /100 | #236 | Tragic 93.1% |
| Immigrants | Panama | 4.3 /100 | #237 | Tragic 93.1% |
| Nigerians | 4.2 /100 | #238 | Tragic 93.1% |
| Costa Ricans | 4.2 /100 | #239 | Tragic 93.1% |
| Immigrants | Hong Kong | 4.2 /100 | #240 | Tragic 93.1% |
| Immigrants | Somalia | 2.7 /100 | #241 | Tragic 93.0% |
| Immigrants | Cameroon | 2.6 /100 | #242 | Tragic 93.0% |
| Senegalese | 2.4 /100 | #243 | Tragic 93.0% |
| Spanish Americans | 2.1 /100 | #244 | Tragic 92.9% |
| Uruguayans | 1.8 /100 | #245 | Tragic 92.9% |
| Immigrants | Middle Africa | 1.7 /100 | #246 | Tragic 92.9% |
| Immigrants | Afghanistan | 1.4 /100 | #247 | Tragic 92.8% |