Greek vs Immigrants from Iraq In Labor Force | Age 25-29
COMPARE
Greek
Immigrants from Iraq
In Labor Force | Age 25-29
In Labor Force | Age 25-29 Comparison
Greeks
Immigrants from Iraq
85.5%
IN LABOR FORCE | AGE 25-29
99.6/ 100
METRIC RATING
58th/ 347
METRIC RANK
84.4%
IN LABOR FORCE | AGE 25-29
19.0/ 100
METRIC RATING
198th/ 347
METRIC RANK
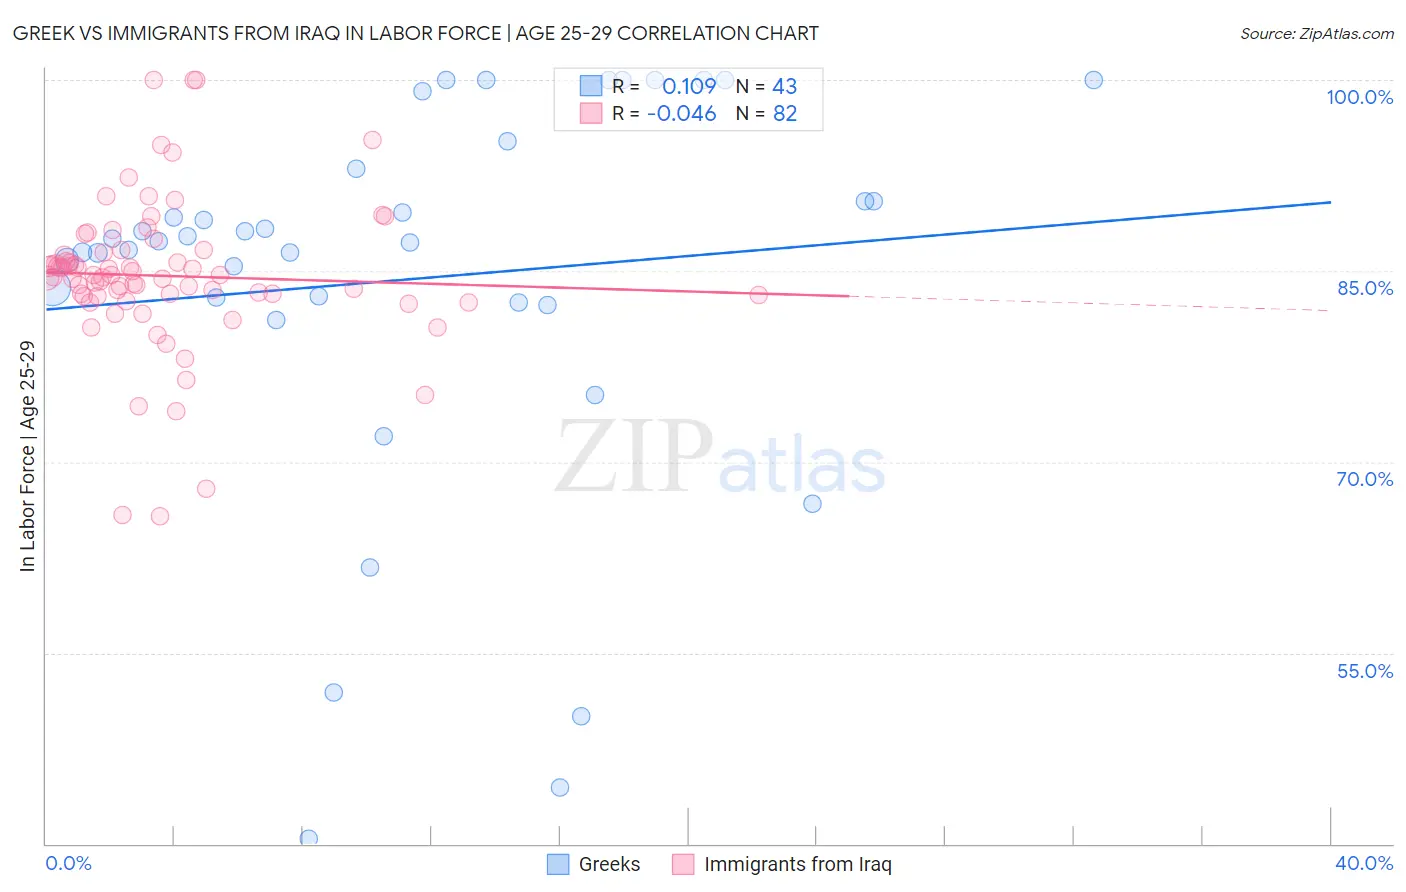
Greek vs Immigrants from Iraq In Labor Force | Age 25-29 Correlation Chart
The statistical analysis conducted on geographies consisting of 482,434,126 people shows a poor positive correlation between the proportion of Greeks and labor force participation rate among population between the ages 25 and 29 in the United States with a correlation coefficient (R) of 0.109 and weighted average of 85.5%. Similarly, the statistical analysis conducted on geographies consisting of 194,759,313 people shows no correlation between the proportion of Immigrants from Iraq and labor force participation rate among population between the ages 25 and 29 in the United States with a correlation coefficient (R) of -0.046 and weighted average of 84.4%, a difference of 1.3%.
In Labor Force | Age 25-29 Correlation Summary
| Measurement | Greek | Immigrants from Iraq |
| Minimum | 40.4% | 65.7% |
| Maximum | 100.0% | 100.0% |
| Range | 59.6% | 34.3% |
| Mean | 84.3% | 84.6% |
| Median | 87.3% | 84.6% |
| Interquartile 25% (IQ1) | 82.6% | 83.0% |
| Interquartile 75% (IQ3) | 93.1% | 86.4% |
| Interquartile Range (IQR) | 10.5% | 3.4% |
| Standard Deviation (Sample) | 15.0% | 6.0% |
| Standard Deviation (Population) | 14.8% | 5.9% |
Similar Demographics by In Labor Force | Age 25-29
Demographics Similar to Greeks by In Labor Force | Age 25-29
In terms of in labor force | age 25-29, the demographic groups most similar to Greeks are Eastern European (85.5%, a difference of 0.010%), Estonian (85.5%, a difference of 0.010%), Immigrants from Morocco (85.5%, a difference of 0.010%), Thai (85.5%, a difference of 0.040%), and Serbian (85.5%, a difference of 0.040%).
| Demographics | Rating | Rank | In Labor Force | Age 25-29 |
| Immigrants | Latvia | 99.8 /100 | #51 | Exceptional 85.6% |
| Immigrants | Poland | 99.7 /100 | #52 | Exceptional 85.6% |
| Belgians | 99.7 /100 | #53 | Exceptional 85.5% |
| Albanians | 99.7 /100 | #54 | Exceptional 85.5% |
| Immigrants | Brazil | 99.7 /100 | #55 | Exceptional 85.5% |
| Eastern Europeans | 99.6 /100 | #56 | Exceptional 85.5% |
| Estonians | 99.6 /100 | #57 | Exceptional 85.5% |
| Greeks | 99.6 /100 | #58 | Exceptional 85.5% |
| Immigrants | Morocco | 99.5 /100 | #59 | Exceptional 85.5% |
| Thais | 99.5 /100 | #60 | Exceptional 85.5% |
| Serbians | 99.5 /100 | #61 | Exceptional 85.5% |
| Taiwanese | 99.4 /100 | #62 | Exceptional 85.4% |
| Immigrants | Kenya | 99.4 /100 | #63 | Exceptional 85.4% |
| Immigrants | Italy | 99.3 /100 | #64 | Exceptional 85.4% |
| Immigrants | Czechoslovakia | 99.3 /100 | #65 | Exceptional 85.4% |
Demographics Similar to Immigrants from Iraq by In Labor Force | Age 25-29
In terms of in labor force | age 25-29, the demographic groups most similar to Immigrants from Iraq are Tlingit-Haida (84.4%, a difference of 0.0%), Immigrants from South Eastern Asia (84.4%, a difference of 0.010%), Immigrants from Germany (84.4%, a difference of 0.010%), Immigrants from Israel (84.4%, a difference of 0.020%), and Immigrants from Kazakhstan (84.4%, a difference of 0.020%).
| Demographics | Rating | Rank | In Labor Force | Age 25-29 |
| Zimbabweans | 28.7 /100 | #191 | Fair 84.5% |
| English | 25.8 /100 | #192 | Fair 84.5% |
| South American Indians | 25.0 /100 | #193 | Fair 84.5% |
| Portuguese | 21.2 /100 | #194 | Fair 84.4% |
| Immigrants | Israel | 20.8 /100 | #195 | Fair 84.4% |
| Immigrants | South Eastern Asia | 19.5 /100 | #196 | Poor 84.4% |
| Tlingit-Haida | 19.3 /100 | #197 | Poor 84.4% |
| Immigrants | Iraq | 19.0 /100 | #198 | Poor 84.4% |
| Immigrants | Germany | 18.3 /100 | #199 | Poor 84.4% |
| Immigrants | Kazakhstan | 17.5 /100 | #200 | Poor 84.4% |
| Laotians | 16.6 /100 | #201 | Poor 84.4% |
| Afghans | 15.9 /100 | #202 | Poor 84.4% |
| Immigrants | Afghanistan | 15.6 /100 | #203 | Poor 84.4% |
| Venezuelans | 15.1 /100 | #204 | Poor 84.4% |
| Ecuadorians | 14.8 /100 | #205 | Poor 84.4% |