Greek vs Iraqi In Labor Force | Age 25-29
COMPARE
Greek
Iraqi
In Labor Force | Age 25-29
In Labor Force | Age 25-29 Comparison
Greeks
Iraqis
85.5%
IN LABOR FORCE | AGE 25-29
99.6/ 100
METRIC RATING
58th/ 347
METRIC RANK
83.9%
IN LABOR FORCE | AGE 25-29
0.9/ 100
METRIC RATING
235th/ 347
METRIC RANK
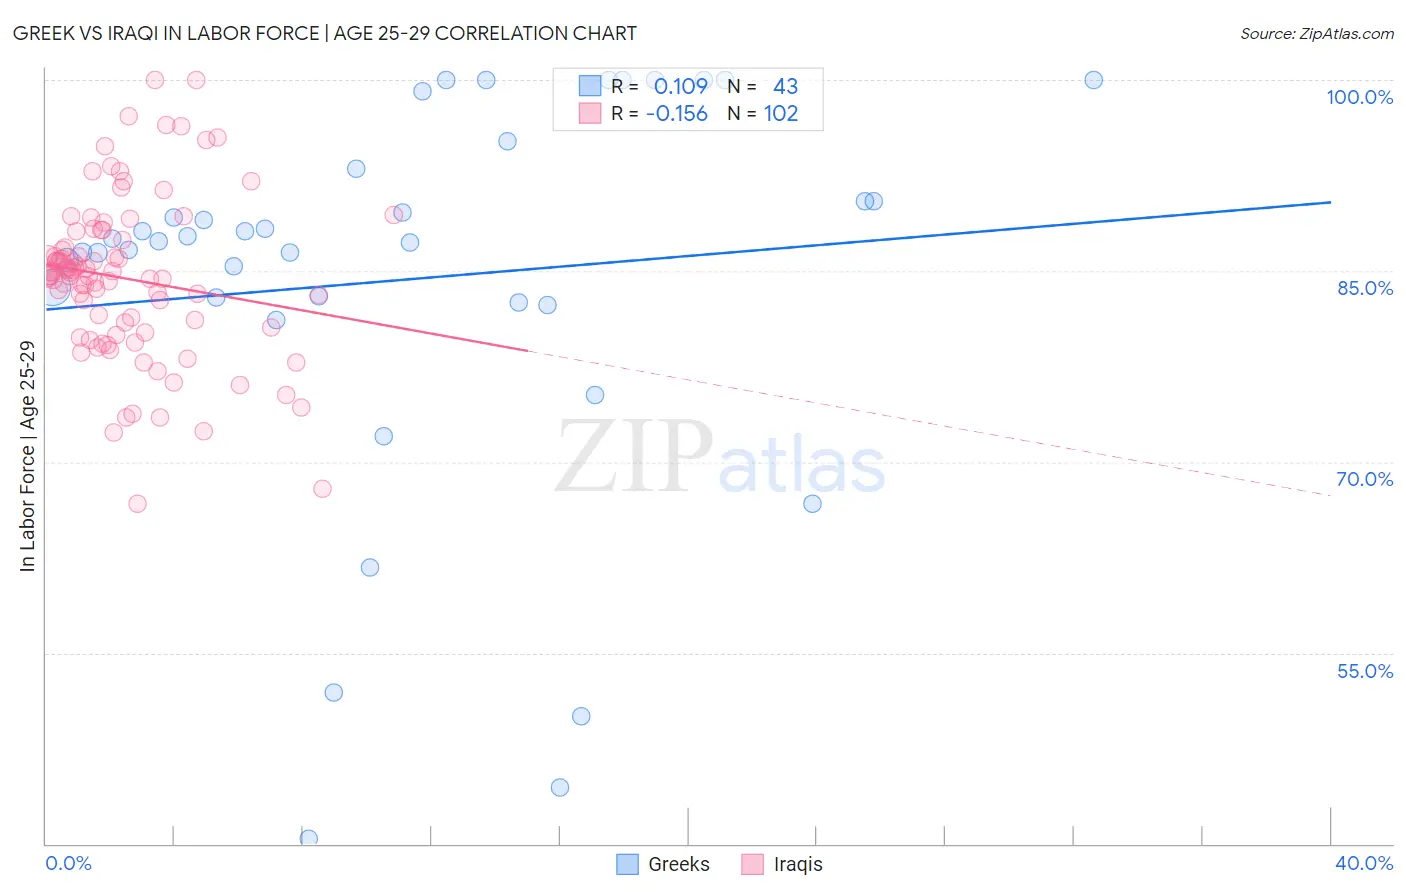
Greek vs Iraqi In Labor Force | Age 25-29 Correlation Chart
The statistical analysis conducted on geographies consisting of 482,434,126 people shows a poor positive correlation between the proportion of Greeks and labor force participation rate among population between the ages 25 and 29 in the United States with a correlation coefficient (R) of 0.109 and weighted average of 85.5%. Similarly, the statistical analysis conducted on geographies consisting of 170,636,038 people shows a poor negative correlation between the proportion of Iraqis and labor force participation rate among population between the ages 25 and 29 in the United States with a correlation coefficient (R) of -0.156 and weighted average of 83.9%, a difference of 1.9%.
In Labor Force | Age 25-29 Correlation Summary
| Measurement | Greek | Iraqi |
| Minimum | 40.4% | 66.7% |
| Maximum | 100.0% | 100.0% |
| Range | 59.6% | 33.3% |
| Mean | 84.3% | 84.4% |
| Median | 87.3% | 84.8% |
| Interquartile 25% (IQ1) | 82.6% | 80.6% |
| Interquartile 75% (IQ3) | 93.1% | 87.5% |
| Interquartile Range (IQR) | 10.5% | 6.9% |
| Standard Deviation (Sample) | 15.0% | 6.3% |
| Standard Deviation (Population) | 14.8% | 6.3% |
Similar Demographics by In Labor Force | Age 25-29
Demographics Similar to Greeks by In Labor Force | Age 25-29
In terms of in labor force | age 25-29, the demographic groups most similar to Greeks are Eastern European (85.5%, a difference of 0.010%), Estonian (85.5%, a difference of 0.010%), Immigrants from Morocco (85.5%, a difference of 0.010%), Thai (85.5%, a difference of 0.040%), and Serbian (85.5%, a difference of 0.040%).
| Demographics | Rating | Rank | In Labor Force | Age 25-29 |
| Immigrants | Latvia | 99.8 /100 | #51 | Exceptional 85.6% |
| Immigrants | Poland | 99.7 /100 | #52 | Exceptional 85.6% |
| Belgians | 99.7 /100 | #53 | Exceptional 85.5% |
| Albanians | 99.7 /100 | #54 | Exceptional 85.5% |
| Immigrants | Brazil | 99.7 /100 | #55 | Exceptional 85.5% |
| Eastern Europeans | 99.6 /100 | #56 | Exceptional 85.5% |
| Estonians | 99.6 /100 | #57 | Exceptional 85.5% |
| Greeks | 99.6 /100 | #58 | Exceptional 85.5% |
| Immigrants | Morocco | 99.5 /100 | #59 | Exceptional 85.5% |
| Thais | 99.5 /100 | #60 | Exceptional 85.5% |
| Serbians | 99.5 /100 | #61 | Exceptional 85.5% |
| Taiwanese | 99.4 /100 | #62 | Exceptional 85.4% |
| Immigrants | Kenya | 99.4 /100 | #63 | Exceptional 85.4% |
| Immigrants | Italy | 99.3 /100 | #64 | Exceptional 85.4% |
| Immigrants | Czechoslovakia | 99.3 /100 | #65 | Exceptional 85.4% |
Demographics Similar to Iraqis by In Labor Force | Age 25-29
In terms of in labor force | age 25-29, the demographic groups most similar to Iraqis are Guamanian/Chamorro (83.9%, a difference of 0.0%), Immigrants (83.9%, a difference of 0.010%), Barbadian (83.9%, a difference of 0.020%), Immigrants from Uzbekistan (83.9%, a difference of 0.030%), and Jamaican (83.9%, a difference of 0.040%).
| Demographics | Rating | Rank | In Labor Force | Age 25-29 |
| Immigrants | Panama | 5.5 /100 | #228 | Tragic 84.2% |
| Immigrants | Oceania | 5.0 /100 | #229 | Tragic 84.2% |
| Whites/Caucasians | 4.8 /100 | #230 | Tragic 84.2% |
| Immigrants | Philippines | 4.7 /100 | #231 | Tragic 84.2% |
| Panamanians | 4.5 /100 | #232 | Tragic 84.2% |
| Immigrants | Western Asia | 2.7 /100 | #233 | Tragic 84.1% |
| Barbadians | 1.0 /100 | #234 | Tragic 83.9% |
| Iraqis | 0.9 /100 | #235 | Tragic 83.9% |
| Guamanians/Chamorros | 0.9 /100 | #236 | Tragic 83.9% |
| Immigrants | Immigrants | 0.9 /100 | #237 | Tragic 83.9% |
| Immigrants | Uzbekistan | 0.8 /100 | #238 | Tragic 83.9% |
| Jamaicans | 0.8 /100 | #239 | Tragic 83.9% |
| Trinidadians and Tobagonians | 0.7 /100 | #240 | Tragic 83.9% |
| Alsatians | 0.7 /100 | #241 | Tragic 83.9% |
| U.S. Virgin Islanders | 0.6 /100 | #242 | Tragic 83.8% |