Greek vs Immigrants from Hong Kong In Labor Force | Age 30-34
COMPARE
Greek
Immigrants from Hong Kong
In Labor Force | Age 30-34
In Labor Force | Age 30-34 Comparison
Greeks
Immigrants from Hong Kong
85.3%
IN LABOR FORCE | AGE 30-34
98.6/ 100
METRIC RATING
84th/ 347
METRIC RANK
85.8%
IN LABOR FORCE | AGE 30-34
100.0/ 100
METRIC RATING
30th/ 347
METRIC RANK
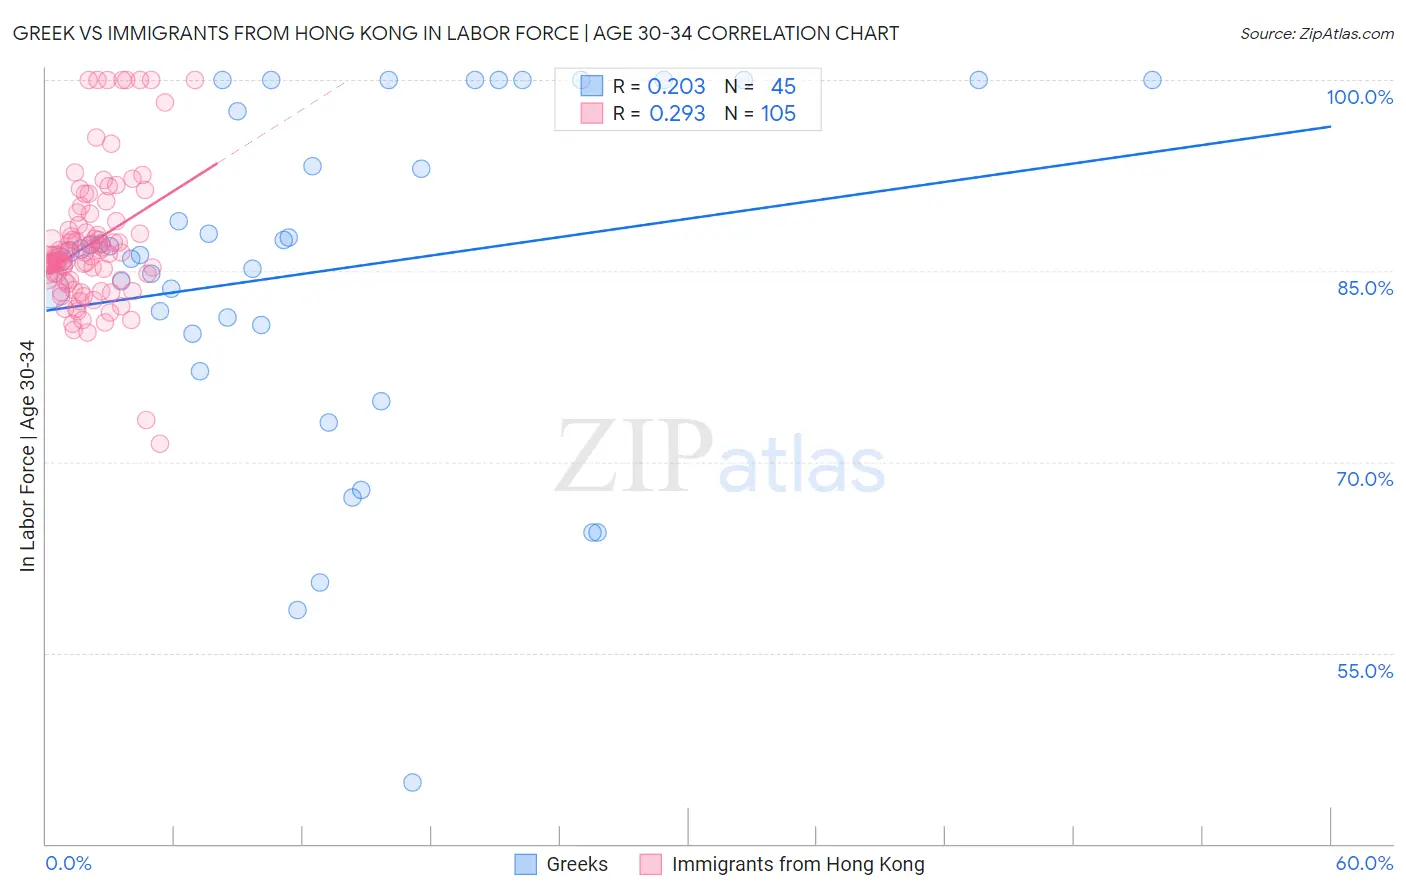
Greek vs Immigrants from Hong Kong In Labor Force | Age 30-34 Correlation Chart
The statistical analysis conducted on geographies consisting of 482,259,585 people shows a weak positive correlation between the proportion of Greeks and labor force participation rate among population between the ages 30 and 34 in the United States with a correlation coefficient (R) of 0.203 and weighted average of 85.3%. Similarly, the statistical analysis conducted on geographies consisting of 253,906,280 people shows a weak positive correlation between the proportion of Immigrants from Hong Kong and labor force participation rate among population between the ages 30 and 34 in the United States with a correlation coefficient (R) of 0.293 and weighted average of 85.8%, a difference of 0.59%.
In Labor Force | Age 30-34 Correlation Summary
| Measurement | Greek | Immigrants from Hong Kong |
| Minimum | 44.8% | 71.4% |
| Maximum | 100.0% | 100.0% |
| Range | 55.2% | 28.6% |
| Mean | 85.0% | 87.2% |
| Median | 86.5% | 86.2% |
| Interquartile 25% (IQ1) | 80.4% | 84.3% |
| Interquartile 75% (IQ3) | 98.8% | 88.7% |
| Interquartile Range (IQR) | 18.4% | 4.5% |
| Standard Deviation (Sample) | 13.1% | 5.3% |
| Standard Deviation (Population) | 13.0% | 5.3% |
Similar Demographics by In Labor Force | Age 30-34
Demographics Similar to Greeks by In Labor Force | Age 30-34
In terms of in labor force | age 30-34, the demographic groups most similar to Greeks are Immigrants from Europe (85.3%, a difference of 0.0%), Slovak (85.3%, a difference of 0.010%), Immigrants from Africa (85.3%, a difference of 0.010%), Mongolian (85.3%, a difference of 0.010%), and Immigrants from Switzerland (85.3%, a difference of 0.020%).
| Demographics | Rating | Rank | In Labor Force | Age 30-34 |
| Immigrants | Eastern Asia | 98.9 /100 | #77 | Exceptional 85.4% |
| Immigrants | Singapore | 98.8 /100 | #78 | Exceptional 85.3% |
| Immigrants | Switzerland | 98.7 /100 | #79 | Exceptional 85.3% |
| Immigrants | Russia | 98.7 /100 | #80 | Exceptional 85.3% |
| Slovaks | 98.7 /100 | #81 | Exceptional 85.3% |
| Immigrants | Africa | 98.6 /100 | #82 | Exceptional 85.3% |
| Immigrants | Europe | 98.6 /100 | #83 | Exceptional 85.3% |
| Greeks | 98.6 /100 | #84 | Exceptional 85.3% |
| Mongolians | 98.5 /100 | #85 | Exceptional 85.3% |
| Immigrants | Taiwan | 98.3 /100 | #86 | Exceptional 85.3% |
| Immigrants | Northern Europe | 98.2 /100 | #87 | Exceptional 85.3% |
| Immigrants | Belgium | 98.2 /100 | #88 | Exceptional 85.3% |
| Immigrants | Kazakhstan | 98.1 /100 | #89 | Exceptional 85.3% |
| Burmese | 97.9 /100 | #90 | Exceptional 85.3% |
| Immigrants | Moldova | 97.9 /100 | #91 | Exceptional 85.3% |
Demographics Similar to Immigrants from Hong Kong by In Labor Force | Age 30-34
In terms of in labor force | age 30-34, the demographic groups most similar to Immigrants from Hong Kong are Paraguayan (85.8%, a difference of 0.020%), Cypriot (85.8%, a difference of 0.020%), Tsimshian (85.8%, a difference of 0.040%), Immigrants from Latvia (85.9%, a difference of 0.060%), and Immigrants from Bosnia and Herzegovina (85.8%, a difference of 0.060%).
| Demographics | Rating | Rank | In Labor Force | Age 30-34 |
| Estonians | 100.0 /100 | #23 | Exceptional 85.9% |
| Immigrants | Eritrea | 100.0 /100 | #24 | Exceptional 85.9% |
| Immigrants | North Macedonia | 100.0 /100 | #25 | Exceptional 85.9% |
| Immigrants | Eastern Africa | 100.0 /100 | #26 | Exceptional 85.9% |
| Immigrants | Liberia | 100.0 /100 | #27 | Exceptional 85.9% |
| Immigrants | Latvia | 100.0 /100 | #28 | Exceptional 85.9% |
| Tsimshian | 100.0 /100 | #29 | Exceptional 85.8% |
| Immigrants | Hong Kong | 100.0 /100 | #30 | Exceptional 85.8% |
| Paraguayans | 99.9 /100 | #31 | Exceptional 85.8% |
| Cypriots | 99.9 /100 | #32 | Exceptional 85.8% |
| Immigrants | Bosnia and Herzegovina | 99.9 /100 | #33 | Exceptional 85.8% |
| Ugandans | 99.9 /100 | #34 | Exceptional 85.8% |
| Serbians | 99.9 /100 | #35 | Exceptional 85.8% |
| Albanians | 99.9 /100 | #36 | Exceptional 85.7% |
| Norwegians | 99.9 /100 | #37 | Exceptional 85.7% |