Ghanaian vs Slavic In Labor Force | Age > 16
COMPARE
Ghanaian
Slavic
In Labor Force | Age > 16
In Labor Force | Age > 16 Comparison
Ghanaians
Slavs
67.1%
IN LABOR FORCE | AGE > 16
100.0/ 100
METRIC RATING
31st/ 347
METRIC RANK
64.6%
IN LABOR FORCE | AGE > 16
4.9/ 100
METRIC RATING
233rd/ 347
METRIC RANK
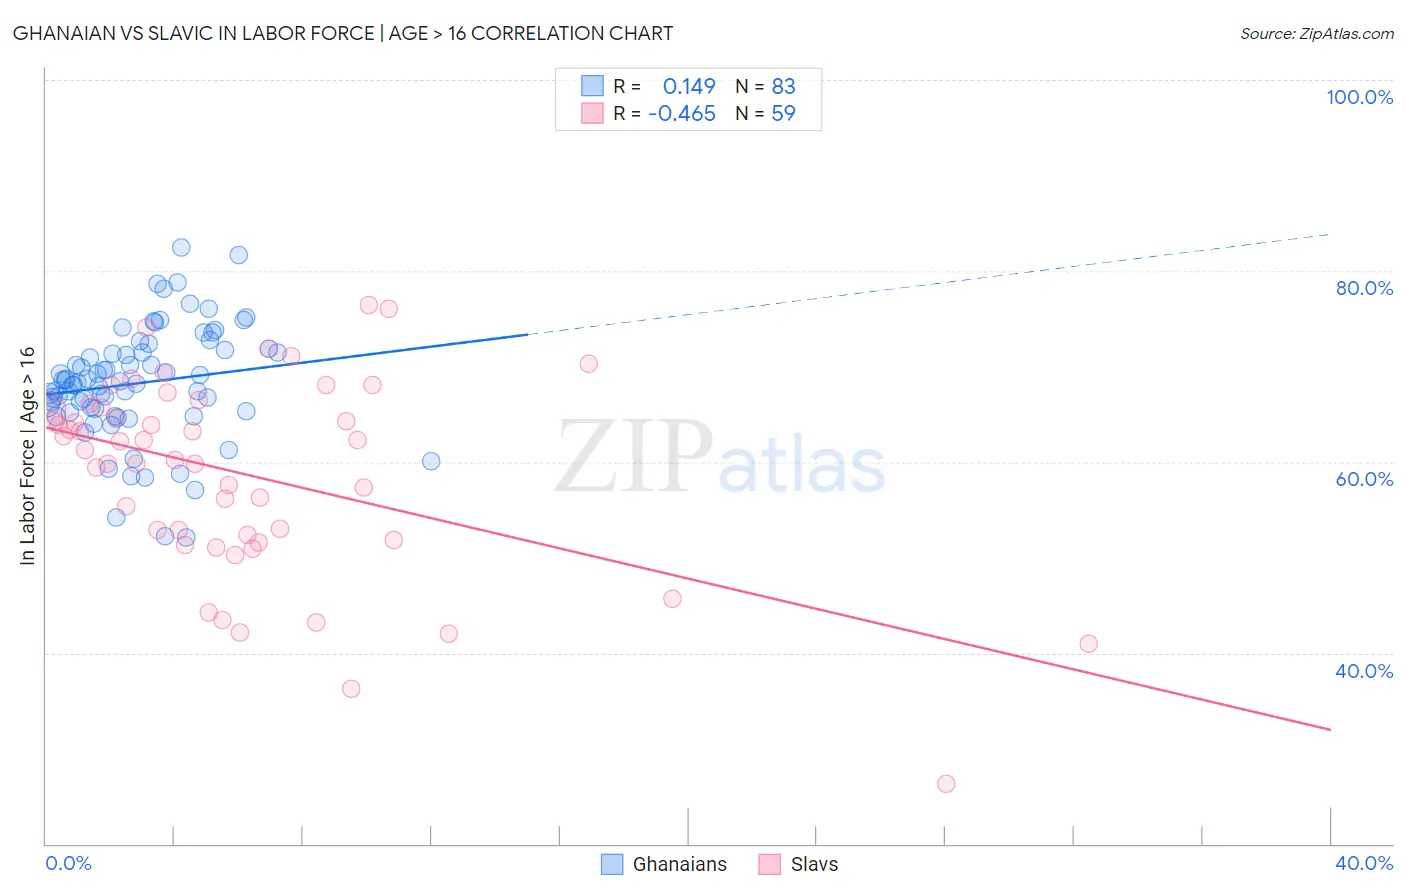
Ghanaian vs Slavic In Labor Force | Age > 16 Correlation Chart
The statistical analysis conducted on geographies consisting of 190,727,867 people shows a poor positive correlation between the proportion of Ghanaians and labor force participation rate among population ages 16 and over in the United States with a correlation coefficient (R) of 0.149 and weighted average of 67.1%. Similarly, the statistical analysis conducted on geographies consisting of 270,879,770 people shows a moderate negative correlation between the proportion of Slavs and labor force participation rate among population ages 16 and over in the United States with a correlation coefficient (R) of -0.465 and weighted average of 64.6%, a difference of 4.0%.
In Labor Force | Age > 16 Correlation Summary
| Measurement | Ghanaian | Slavic |
| Minimum | 52.1% | 26.3% |
| Maximum | 82.4% | 76.4% |
| Range | 30.3% | 50.1% |
| Mean | 68.2% | 58.7% |
| Median | 68.3% | 61.2% |
| Interquartile 25% (IQ1) | 65.3% | 51.8% |
| Interquartile 75% (IQ3) | 71.7% | 65.8% |
| Interquartile Range (IQR) | 6.4% | 14.0% |
| Standard Deviation (Sample) | 5.9% | 10.3% |
| Standard Deviation (Population) | 5.9% | 10.2% |
Similar Demographics by In Labor Force | Age > 16
Demographics Similar to Ghanaians by In Labor Force | Age > 16
In terms of in labor force | age > 16, the demographic groups most similar to Ghanaians are Immigrants from Congo (67.1%, a difference of 0.060%), Afghan (67.1%, a difference of 0.060%), Immigrants from Ghana (67.1%, a difference of 0.070%), Immigrants from Zaire (67.2%, a difference of 0.10%), and Thai (67.2%, a difference of 0.11%).
| Demographics | Rating | Rank | In Labor Force | Age > 16 |
| Ugandans | 100.0 /100 | #24 | Exceptional 67.4% |
| Immigrants | Africa | 100.0 /100 | #25 | Exceptional 67.4% |
| Immigrants | Cabo Verde | 100.0 /100 | #26 | Exceptional 67.3% |
| Zimbabweans | 100.0 /100 | #27 | Exceptional 67.3% |
| Immigrants | Morocco | 100.0 /100 | #28 | Exceptional 67.2% |
| Thais | 100.0 /100 | #29 | Exceptional 67.2% |
| Immigrants | Zaire | 100.0 /100 | #30 | Exceptional 67.2% |
| Ghanaians | 100.0 /100 | #31 | Exceptional 67.1% |
| Immigrants | Congo | 100.0 /100 | #32 | Exceptional 67.1% |
| Afghans | 100.0 /100 | #33 | Exceptional 67.1% |
| Immigrants | Ghana | 100.0 /100 | #34 | Exceptional 67.1% |
| Immigrants | South Central Asia | 100.0 /100 | #35 | Exceptional 67.1% |
| Immigrants | Western Africa | 100.0 /100 | #36 | Exceptional 67.1% |
| Immigrants | Afghanistan | 100.0 /100 | #37 | Exceptional 67.0% |
| Immigrants | Nigeria | 100.0 /100 | #38 | Exceptional 66.9% |
Demographics Similar to Slavs by In Labor Force | Age > 16
In terms of in labor force | age > 16, the demographic groups most similar to Slavs are Vietnamese (64.6%, a difference of 0.010%), Austrian (64.6%, a difference of 0.020%), Immigrants from Norway (64.6%, a difference of 0.020%), Italian (64.6%, a difference of 0.020%), and African (64.6%, a difference of 0.050%).
| Demographics | Rating | Rank | In Labor Force | Age > 16 |
| Europeans | 8.3 /100 | #226 | Tragic 64.7% |
| Poles | 8.3 /100 | #227 | Tragic 64.7% |
| Northern Europeans | 8.2 /100 | #228 | Tragic 64.7% |
| British | 7.3 /100 | #229 | Tragic 64.7% |
| Chinese | 7.3 /100 | #230 | Tragic 64.7% |
| Immigrants | Northern Europe | 7.2 /100 | #231 | Tragic 64.7% |
| Africans | 5.8 /100 | #232 | Tragic 64.6% |
| Slavs | 4.9 /100 | #233 | Tragic 64.6% |
| Vietnamese | 4.7 /100 | #234 | Tragic 64.6% |
| Austrians | 4.6 /100 | #235 | Tragic 64.6% |
| Immigrants | Norway | 4.6 /100 | #236 | Tragic 64.6% |
| Italians | 4.6 /100 | #237 | Tragic 64.6% |
| Lebanese | 3.9 /100 | #238 | Tragic 64.5% |
| Immigrants | Hungary | 3.8 /100 | #239 | Tragic 64.5% |
| Immigrants | Bangladesh | 3.6 /100 | #240 | Tragic 64.5% |