Paraguayan vs West Indian In Labor Force | Age > 16
COMPARE
Paraguayan
West Indian
In Labor Force | Age > 16
In Labor Force | Age > 16 Comparison
Paraguayans
West Indians
66.5%
IN LABOR FORCE | AGE > 16
99.9/ 100
METRIC RATING
52nd/ 347
METRIC RANK
64.5%
IN LABOR FORCE | AGE > 16
3.0/ 100
METRIC RATING
245th/ 347
METRIC RANK
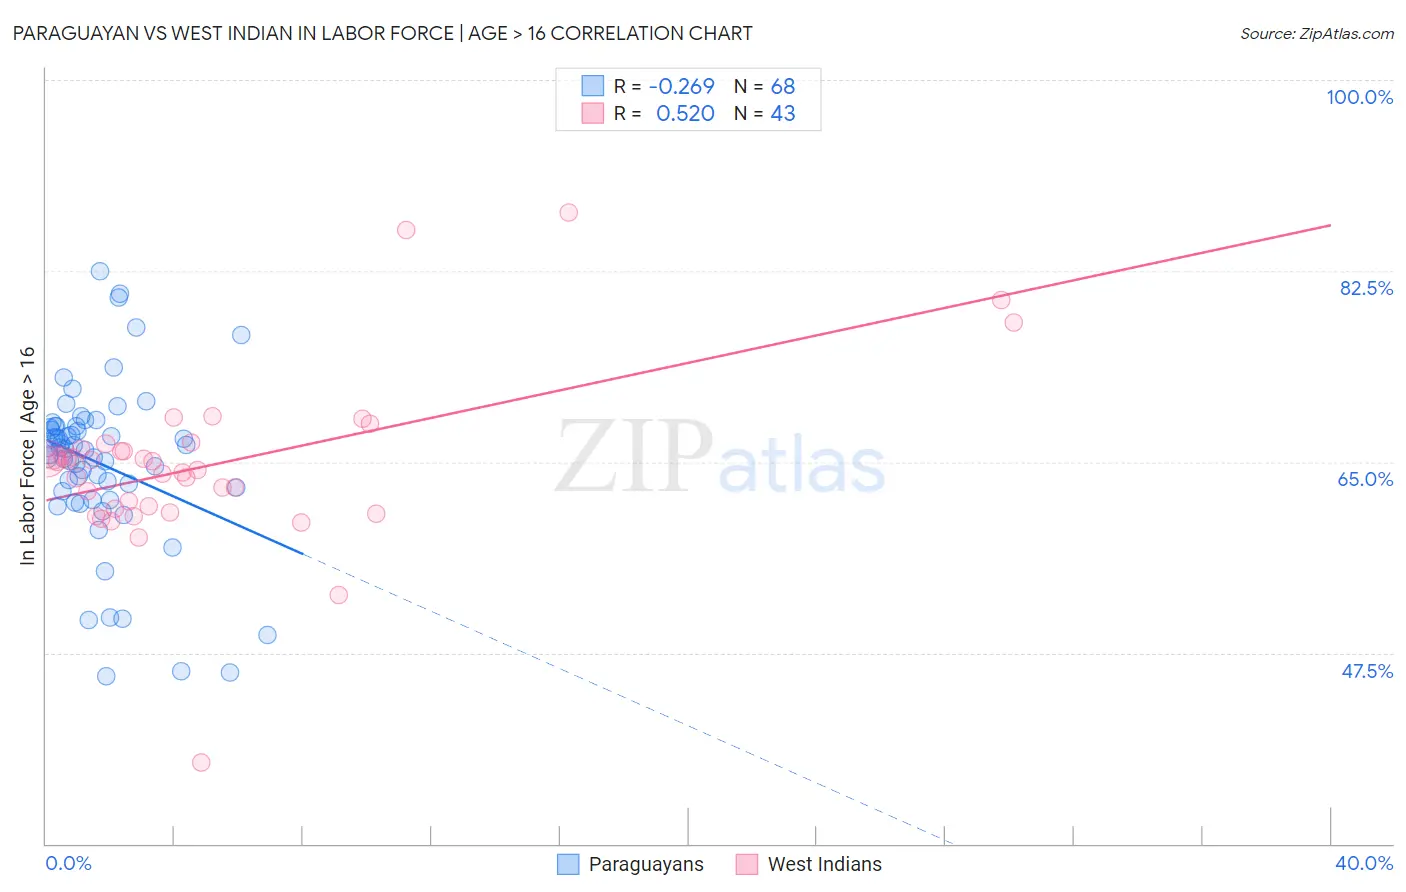
Paraguayan vs West Indian In Labor Force | Age > 16 Correlation Chart
The statistical analysis conducted on geographies consisting of 95,115,093 people shows a weak negative correlation between the proportion of Paraguayans and labor force participation rate among population ages 16 and over in the United States with a correlation coefficient (R) of -0.269 and weighted average of 66.5%. Similarly, the statistical analysis conducted on geographies consisting of 254,052,877 people shows a substantial positive correlation between the proportion of West Indians and labor force participation rate among population ages 16 and over in the United States with a correlation coefficient (R) of 0.520 and weighted average of 64.5%, a difference of 3.1%.
In Labor Force | Age > 16 Correlation Summary
| Measurement | Paraguayan | West Indian |
| Minimum | 45.4% | 37.5% |
| Maximum | 82.5% | 87.9% |
| Range | 37.1% | 50.4% |
| Mean | 64.8% | 64.8% |
| Median | 66.1% | 65.1% |
| Interquartile 25% (IQ1) | 61.9% | 60.7% |
| Interquartile 75% (IQ3) | 68.2% | 66.2% |
| Interquartile Range (IQR) | 6.3% | 5.5% |
| Standard Deviation (Sample) | 7.6% | 7.9% |
| Standard Deviation (Population) | 7.5% | 7.8% |
Similar Demographics by In Labor Force | Age > 16
Demographics Similar to Paraguayans by In Labor Force | Age > 16
In terms of in labor force | age > 16, the demographic groups most similar to Paraguayans are Immigrants from Sri Lanka (66.5%, a difference of 0.020%), Immigrants from Kuwait (66.5%, a difference of 0.030%), Immigrants from Bosnia and Herzegovina (66.5%, a difference of 0.050%), Cape Verdean (66.6%, a difference of 0.10%), and Immigrants from Venezuela (66.4%, a difference of 0.10%).
| Demographics | Rating | Rank | In Labor Force | Age > 16 |
| Immigrants | Brazil | 100.0 /100 | #45 | Exceptional 66.7% |
| Brazilians | 100.0 /100 | #46 | Exceptional 66.6% |
| Immigrants | Bulgaria | 100.0 /100 | #47 | Exceptional 66.6% |
| Nigerians | 100.0 /100 | #48 | Exceptional 66.6% |
| Immigrants | Northern Africa | 100.0 /100 | #49 | Exceptional 66.6% |
| Cape Verdeans | 100.0 /100 | #50 | Exceptional 66.6% |
| Immigrants | Kuwait | 100.0 /100 | #51 | Exceptional 66.5% |
| Paraguayans | 99.9 /100 | #52 | Exceptional 66.5% |
| Immigrants | Sri Lanka | 99.9 /100 | #53 | Exceptional 66.5% |
| Immigrants | Bosnia and Herzegovina | 99.9 /100 | #54 | Exceptional 66.5% |
| Immigrants | Venezuela | 99.9 /100 | #55 | Exceptional 66.4% |
| Immigrants | Senegal | 99.9 /100 | #56 | Exceptional 66.4% |
| Bulgarians | 99.9 /100 | #57 | Exceptional 66.4% |
| Immigrants | Saudi Arabia | 99.9 /100 | #58 | Exceptional 66.3% |
| Immigrants | Turkey | 99.9 /100 | #59 | Exceptional 66.3% |
Demographics Similar to West Indians by In Labor Force | Age > 16
In terms of in labor force | age > 16, the demographic groups most similar to West Indians are Tsimshian (64.5%, a difference of 0.0%), Immigrants from Lebanon (64.5%, a difference of 0.020%), Immigrants from Netherlands (64.5%, a difference of 0.030%), Immigrants from Dominica (64.5%, a difference of 0.040%), and Immigrants from Bangladesh (64.5%, a difference of 0.050%).
| Demographics | Rating | Rank | In Labor Force | Age > 16 |
| Lebanese | 3.9 /100 | #238 | Tragic 64.5% |
| Immigrants | Hungary | 3.8 /100 | #239 | Tragic 64.5% |
| Immigrants | Bangladesh | 3.6 /100 | #240 | Tragic 64.5% |
| Immigrants | Dominica | 3.5 /100 | #241 | Tragic 64.5% |
| Immigrants | Netherlands | 3.4 /100 | #242 | Tragic 64.5% |
| Immigrants | Lebanon | 3.2 /100 | #243 | Tragic 64.5% |
| Tsimshian | 3.1 /100 | #244 | Tragic 64.5% |
| West Indians | 3.0 /100 | #245 | Tragic 64.5% |
| Immigrants | Caribbean | 2.3 /100 | #246 | Tragic 64.4% |
| Swiss | 2.1 /100 | #247 | Tragic 64.4% |
| Immigrants | Barbados | 2.1 /100 | #248 | Tragic 64.4% |
| Germans | 1.8 /100 | #249 | Tragic 64.4% |
| British West Indians | 1.8 /100 | #250 | Tragic 64.4% |
| Portuguese | 1.6 /100 | #251 | Tragic 64.4% |
| Immigrants | Dominican Republic | 1.5 /100 | #252 | Tragic 64.4% |