Immigrants from Yemen vs West Indian In Labor Force | Age > 16
COMPARE
Immigrants from Yemen
West Indian
In Labor Force | Age > 16
In Labor Force | Age > 16 Comparison
Immigrants from Yemen
West Indians
59.6%
IN LABOR FORCE | AGE > 16
0.0/ 100
METRIC RATING
338th/ 347
METRIC RANK
64.5%
IN LABOR FORCE | AGE > 16
3.0/ 100
METRIC RATING
245th/ 347
METRIC RANK
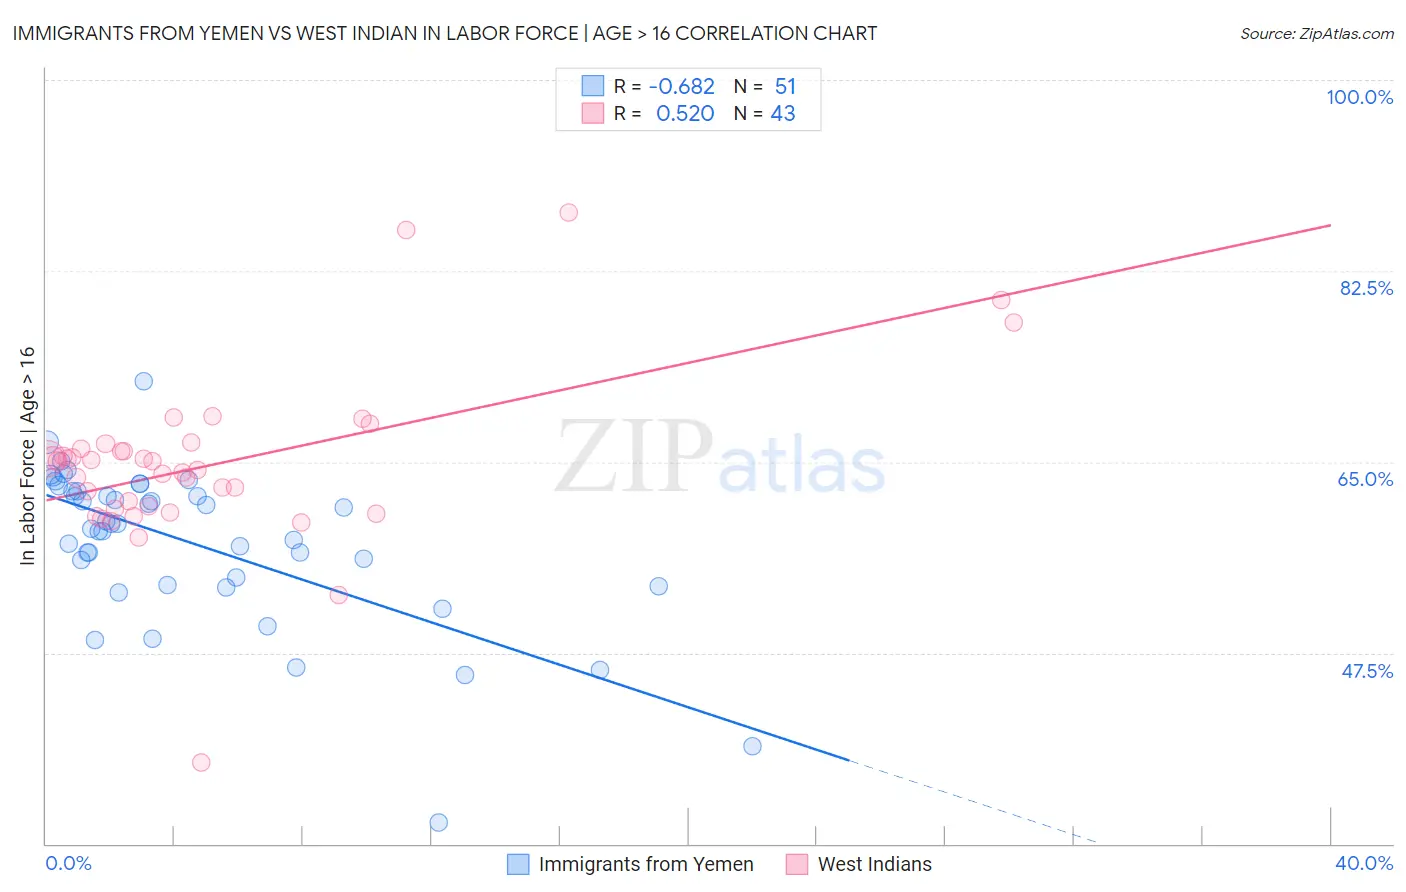
Immigrants from Yemen vs West Indian In Labor Force | Age > 16 Correlation Chart
The statistical analysis conducted on geographies consisting of 82,433,611 people shows a significant negative correlation between the proportion of Immigrants from Yemen and labor force participation rate among population ages 16 and over in the United States with a correlation coefficient (R) of -0.682 and weighted average of 59.6%. Similarly, the statistical analysis conducted on geographies consisting of 254,052,877 people shows a substantial positive correlation between the proportion of West Indians and labor force participation rate among population ages 16 and over in the United States with a correlation coefficient (R) of 0.520 and weighted average of 64.5%, a difference of 8.1%.
In Labor Force | Age > 16 Correlation Summary
| Measurement | Immigrants from Yemen | West Indian |
| Minimum | 32.0% | 37.5% |
| Maximum | 72.4% | 87.9% |
| Range | 40.4% | 50.4% |
| Mean | 57.6% | 64.8% |
| Median | 59.3% | 65.1% |
| Interquartile 25% (IQ1) | 53.7% | 60.7% |
| Interquartile 75% (IQ3) | 62.3% | 66.2% |
| Interquartile Range (IQR) | 8.6% | 5.5% |
| Standard Deviation (Sample) | 7.2% | 7.9% |
| Standard Deviation (Population) | 7.2% | 7.8% |
Similar Demographics by In Labor Force | Age > 16
Demographics Similar to Immigrants from Yemen by In Labor Force | Age > 16
In terms of in labor force | age > 16, the demographic groups most similar to Immigrants from Yemen are Houma (59.5%, a difference of 0.25%), Colville (59.8%, a difference of 0.27%), Pueblo (59.3%, a difference of 0.64%), Menominee (60.6%, a difference of 1.5%), and Native/Alaskan (60.6%, a difference of 1.6%).
| Demographics | Rating | Rank | In Labor Force | Age > 16 |
| Ute | 0.0 /100 | #331 | Tragic 60.9% |
| Crow | 0.0 /100 | #332 | Tragic 60.8% |
| Paiute | 0.0 /100 | #333 | Tragic 60.7% |
| Apache | 0.0 /100 | #334 | Tragic 60.7% |
| Natives/Alaskans | 0.0 /100 | #335 | Tragic 60.6% |
| Menominee | 0.0 /100 | #336 | Tragic 60.6% |
| Colville | 0.0 /100 | #337 | Tragic 59.8% |
| Immigrants | Yemen | 0.0 /100 | #338 | Tragic 59.6% |
| Houma | 0.0 /100 | #339 | Tragic 59.5% |
| Pueblo | 0.0 /100 | #340 | Tragic 59.3% |
| Hopi | 0.0 /100 | #341 | Tragic 58.4% |
| Puerto Ricans | 0.0 /100 | #342 | Tragic 58.1% |
| Yuman | 0.0 /100 | #343 | Tragic 57.8% |
| Pima | 0.0 /100 | #344 | Tragic 57.4% |
| Tohono O'odham | 0.0 /100 | #345 | Tragic 57.2% |
Demographics Similar to West Indians by In Labor Force | Age > 16
In terms of in labor force | age > 16, the demographic groups most similar to West Indians are Tsimshian (64.5%, a difference of 0.0%), Immigrants from Lebanon (64.5%, a difference of 0.020%), Immigrants from Netherlands (64.5%, a difference of 0.030%), Immigrants from Dominica (64.5%, a difference of 0.040%), and Immigrants from Bangladesh (64.5%, a difference of 0.050%).
| Demographics | Rating | Rank | In Labor Force | Age > 16 |
| Lebanese | 3.9 /100 | #238 | Tragic 64.5% |
| Immigrants | Hungary | 3.8 /100 | #239 | Tragic 64.5% |
| Immigrants | Bangladesh | 3.6 /100 | #240 | Tragic 64.5% |
| Immigrants | Dominica | 3.5 /100 | #241 | Tragic 64.5% |
| Immigrants | Netherlands | 3.4 /100 | #242 | Tragic 64.5% |
| Immigrants | Lebanon | 3.2 /100 | #243 | Tragic 64.5% |
| Tsimshian | 3.1 /100 | #244 | Tragic 64.5% |
| West Indians | 3.0 /100 | #245 | Tragic 64.5% |
| Immigrants | Caribbean | 2.3 /100 | #246 | Tragic 64.4% |
| Swiss | 2.1 /100 | #247 | Tragic 64.4% |
| Immigrants | Barbados | 2.1 /100 | #248 | Tragic 64.4% |
| Germans | 1.8 /100 | #249 | Tragic 64.4% |
| British West Indians | 1.8 /100 | #250 | Tragic 64.4% |
| Portuguese | 1.6 /100 | #251 | Tragic 64.4% |
| Immigrants | Dominican Republic | 1.5 /100 | #252 | Tragic 64.4% |