Ghanaian vs Immigrants from Costa Rica In Labor Force | Age > 16
COMPARE
Ghanaian
Immigrants from Costa Rica
In Labor Force | Age > 16
In Labor Force | Age > 16 Comparison
Ghanaians
Immigrants from Costa Rica
67.1%
IN LABOR FORCE | AGE > 16
100.0/ 100
METRIC RATING
31st/ 347
METRIC RANK
65.5%
IN LABOR FORCE | AGE > 16
90.8/ 100
METRIC RATING
140th/ 347
METRIC RANK
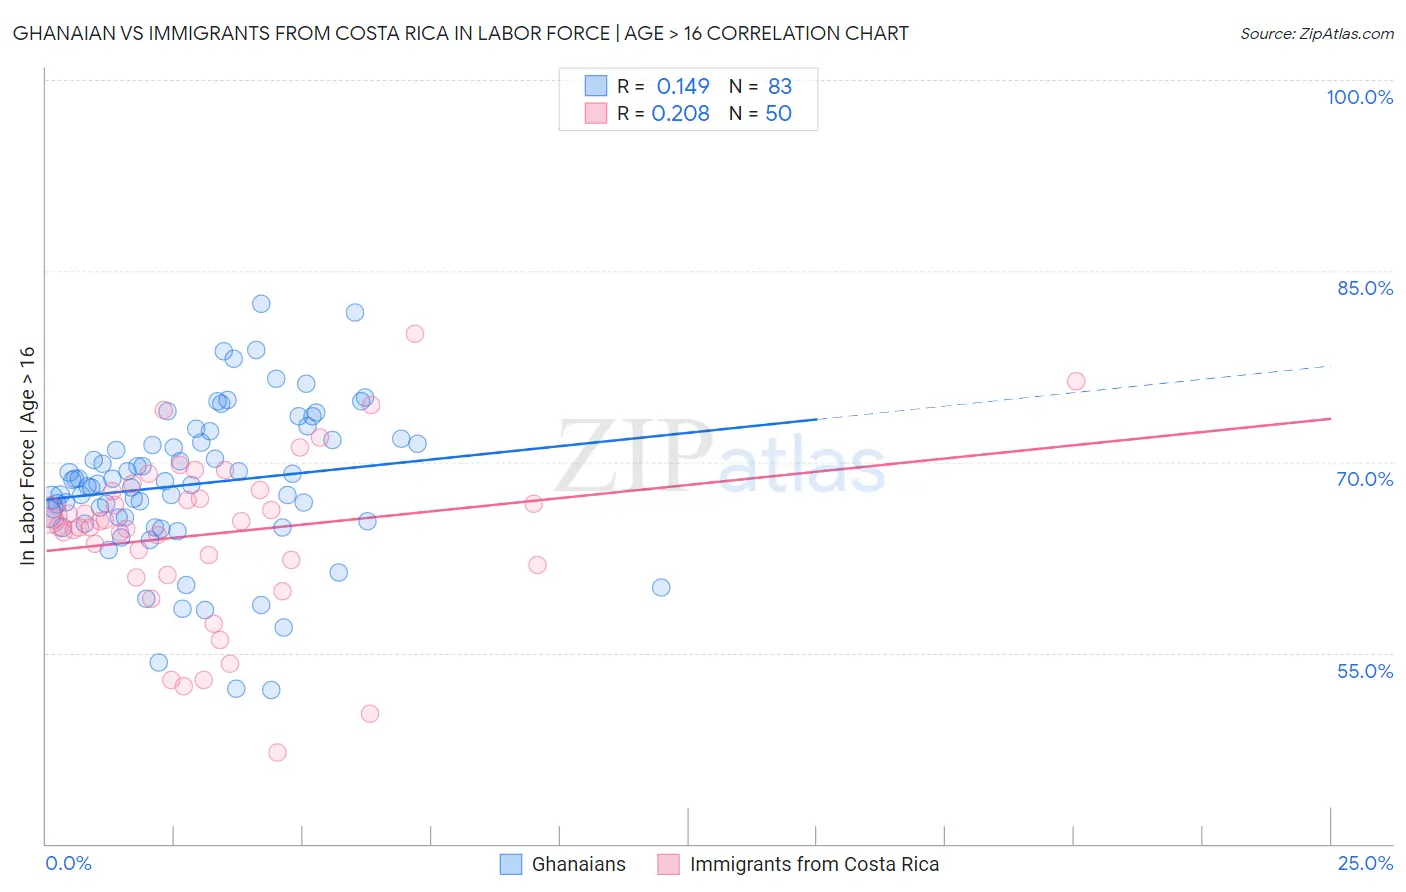
Ghanaian vs Immigrants from Costa Rica In Labor Force | Age > 16 Correlation Chart
The statistical analysis conducted on geographies consisting of 190,727,867 people shows a poor positive correlation between the proportion of Ghanaians and labor force participation rate among population ages 16 and over in the United States with a correlation coefficient (R) of 0.149 and weighted average of 67.1%. Similarly, the statistical analysis conducted on geographies consisting of 204,275,671 people shows a weak positive correlation between the proportion of Immigrants from Costa Rica and labor force participation rate among population ages 16 and over in the United States with a correlation coefficient (R) of 0.208 and weighted average of 65.5%, a difference of 2.5%.
In Labor Force | Age > 16 Correlation Summary
| Measurement | Ghanaian | Immigrants from Costa Rica |
| Minimum | 52.1% | 47.1% |
| Maximum | 82.4% | 80.1% |
| Range | 30.3% | 33.0% |
| Mean | 68.2% | 64.3% |
| Median | 68.3% | 65.1% |
| Interquartile 25% (IQ1) | 65.3% | 61.9% |
| Interquartile 75% (IQ3) | 71.7% | 67.7% |
| Interquartile Range (IQR) | 6.4% | 5.8% |
| Standard Deviation (Sample) | 5.9% | 6.5% |
| Standard Deviation (Population) | 5.9% | 6.5% |
Similar Demographics by In Labor Force | Age > 16
Demographics Similar to Ghanaians by In Labor Force | Age > 16
In terms of in labor force | age > 16, the demographic groups most similar to Ghanaians are Immigrants from Congo (67.1%, a difference of 0.060%), Afghan (67.1%, a difference of 0.060%), Immigrants from Ghana (67.1%, a difference of 0.070%), Immigrants from Zaire (67.2%, a difference of 0.10%), and Thai (67.2%, a difference of 0.11%).
| Demographics | Rating | Rank | In Labor Force | Age > 16 |
| Ugandans | 100.0 /100 | #24 | Exceptional 67.4% |
| Immigrants | Africa | 100.0 /100 | #25 | Exceptional 67.4% |
| Immigrants | Cabo Verde | 100.0 /100 | #26 | Exceptional 67.3% |
| Zimbabweans | 100.0 /100 | #27 | Exceptional 67.3% |
| Immigrants | Morocco | 100.0 /100 | #28 | Exceptional 67.2% |
| Thais | 100.0 /100 | #29 | Exceptional 67.2% |
| Immigrants | Zaire | 100.0 /100 | #30 | Exceptional 67.2% |
| Ghanaians | 100.0 /100 | #31 | Exceptional 67.1% |
| Immigrants | Congo | 100.0 /100 | #32 | Exceptional 67.1% |
| Afghans | 100.0 /100 | #33 | Exceptional 67.1% |
| Immigrants | Ghana | 100.0 /100 | #34 | Exceptional 67.1% |
| Immigrants | South Central Asia | 100.0 /100 | #35 | Exceptional 67.1% |
| Immigrants | Western Africa | 100.0 /100 | #36 | Exceptional 67.1% |
| Immigrants | Afghanistan | 100.0 /100 | #37 | Exceptional 67.0% |
| Immigrants | Nigeria | 100.0 /100 | #38 | Exceptional 66.9% |
Demographics Similar to Immigrants from Costa Rica by In Labor Force | Age > 16
In terms of in labor force | age > 16, the demographic groups most similar to Immigrants from Costa Rica are Immigrants from Taiwan (65.5%, a difference of 0.0%), Samoan (65.5%, a difference of 0.010%), Indian (Asian) (65.5%, a difference of 0.040%), Latvian (65.5%, a difference of 0.040%), and Immigrants from West Indies (65.6%, a difference of 0.050%).
| Demographics | Rating | Rank | In Labor Force | Age > 16 |
| Immigrants | Lithuania | 93.5 /100 | #133 | Exceptional 65.6% |
| Costa Ricans | 93.2 /100 | #134 | Exceptional 65.6% |
| Guatemalans | 92.5 /100 | #135 | Exceptional 65.6% |
| Immigrants | Argentina | 92.4 /100 | #136 | Exceptional 65.6% |
| Guamanians/Chamorros | 92.4 /100 | #137 | Exceptional 65.6% |
| Immigrants | West Indies | 92.0 /100 | #138 | Exceptional 65.6% |
| Immigrants | Taiwan | 90.8 /100 | #139 | Exceptional 65.5% |
| Immigrants | Costa Rica | 90.8 /100 | #140 | Exceptional 65.5% |
| Samoans | 90.5 /100 | #141 | Exceptional 65.5% |
| Indians (Asian) | 89.5 /100 | #142 | Excellent 65.5% |
| Latvians | 89.4 /100 | #143 | Excellent 65.5% |
| Immigrants | Romania | 88.6 /100 | #144 | Excellent 65.5% |
| Tlingit-Haida | 88.3 /100 | #145 | Excellent 65.5% |
| Cypriots | 88.2 /100 | #146 | Excellent 65.5% |
| Immigrants | Oceania | 87.5 /100 | #147 | Excellent 65.5% |