Danish vs Immigrants from Costa Rica In Labor Force | Age > 16
COMPARE
Danish
Immigrants from Costa Rica
In Labor Force | Age > 16
In Labor Force | Age > 16 Comparison
Danes
Immigrants from Costa Rica
65.3%
IN LABOR FORCE | AGE > 16
68.8/ 100
METRIC RATING
164th/ 347
METRIC RANK
65.5%
IN LABOR FORCE | AGE > 16
90.8/ 100
METRIC RATING
140th/ 347
METRIC RANK
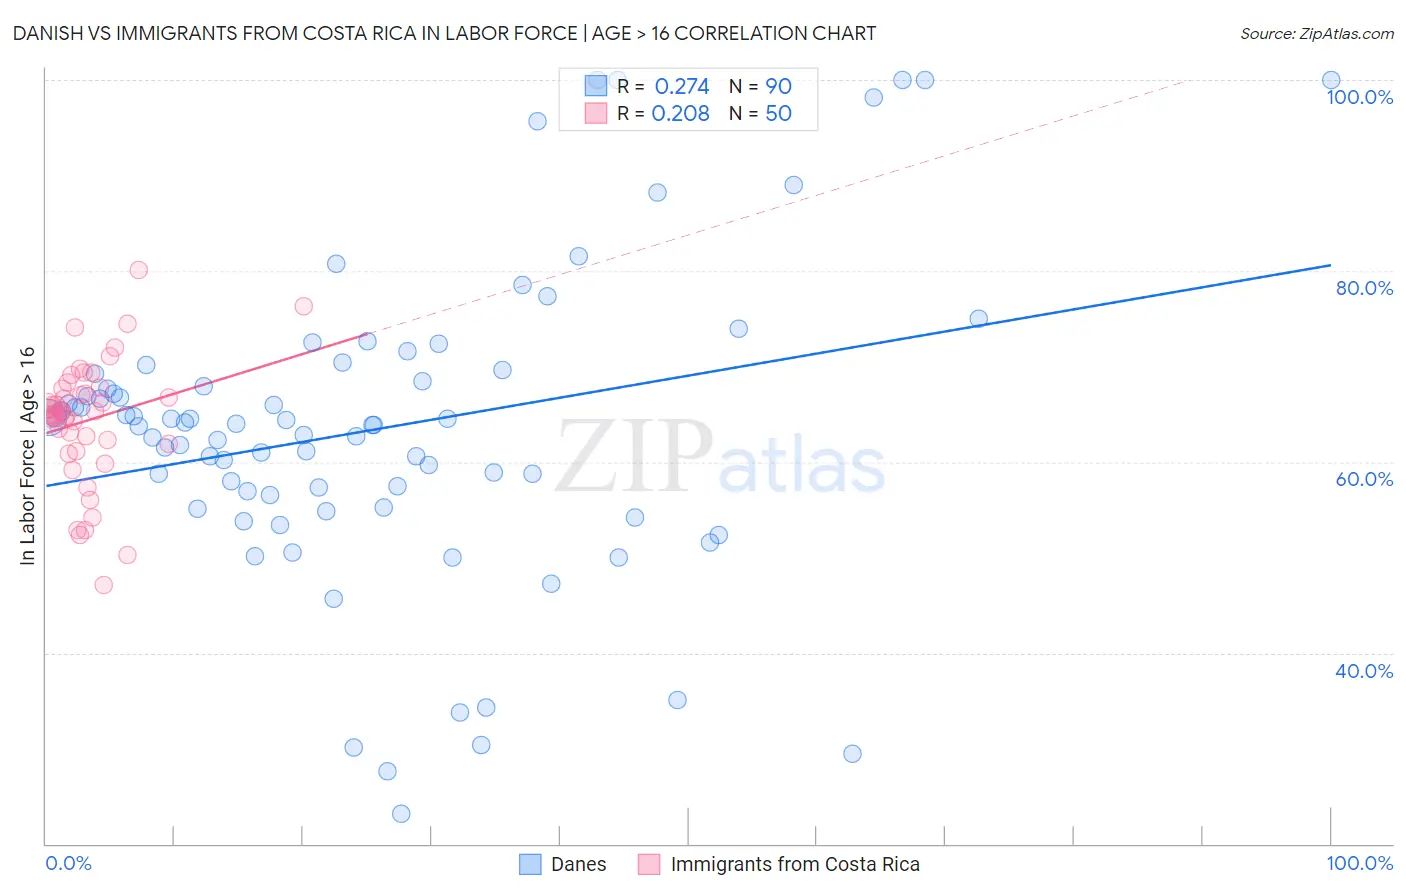
Danish vs Immigrants from Costa Rica In Labor Force | Age > 16 Correlation Chart
The statistical analysis conducted on geographies consisting of 474,191,872 people shows a weak positive correlation between the proportion of Danes and labor force participation rate among population ages 16 and over in the United States with a correlation coefficient (R) of 0.274 and weighted average of 65.3%. Similarly, the statistical analysis conducted on geographies consisting of 204,275,671 people shows a weak positive correlation between the proportion of Immigrants from Costa Rica and labor force participation rate among population ages 16 and over in the United States with a correlation coefficient (R) of 0.208 and weighted average of 65.5%, a difference of 0.42%.
In Labor Force | Age > 16 Correlation Summary
| Measurement | Danish | Immigrants from Costa Rica |
| Minimum | 23.1% | 47.1% |
| Maximum | 100.0% | 80.1% |
| Range | 76.9% | 33.0% |
| Mean | 63.4% | 64.3% |
| Median | 63.9% | 65.1% |
| Interquartile 25% (IQ1) | 56.6% | 61.9% |
| Interquartile 75% (IQ3) | 69.2% | 67.7% |
| Interquartile Range (IQR) | 12.7% | 5.8% |
| Standard Deviation (Sample) | 16.2% | 6.5% |
| Standard Deviation (Population) | 16.1% | 6.5% |
Similar Demographics by In Labor Force | Age > 16
Demographics Similar to Danes by In Labor Force | Age > 16
In terms of in labor force | age > 16, the demographic groups most similar to Danes are South African (65.3%, a difference of 0.010%), Immigrants from Kazakhstan (65.3%, a difference of 0.010%), Immigrants from Western Asia (65.3%, a difference of 0.020%), Australian (65.3%, a difference of 0.030%), and Albanian (65.3%, a difference of 0.030%).
| Demographics | Rating | Rank | In Labor Force | Age > 16 |
| Immigrants | Russia | 75.7 /100 | #157 | Good 65.3% |
| Panamanians | 75.2 /100 | #158 | Good 65.3% |
| Immigrants | Syria | 74.6 /100 | #159 | Good 65.3% |
| Immigrants | South Africa | 73.5 /100 | #160 | Good 65.3% |
| Australians | 71.3 /100 | #161 | Good 65.3% |
| Albanians | 70.8 /100 | #162 | Good 65.3% |
| South Africans | 69.8 /100 | #163 | Good 65.3% |
| Danes | 68.8 /100 | #164 | Good 65.3% |
| Immigrants | Kazakhstan | 68.1 /100 | #165 | Good 65.3% |
| Immigrants | Western Asia | 67.3 /100 | #166 | Good 65.3% |
| Immigrants | Belarus | 66.0 /100 | #167 | Good 65.2% |
| Serbians | 63.5 /100 | #168 | Good 65.2% |
| Arabs | 62.4 /100 | #169 | Good 65.2% |
| Immigrants | Israel | 61.7 /100 | #170 | Good 65.2% |
| Israelis | 61.6 /100 | #171 | Good 65.2% |
Demographics Similar to Immigrants from Costa Rica by In Labor Force | Age > 16
In terms of in labor force | age > 16, the demographic groups most similar to Immigrants from Costa Rica are Immigrants from Taiwan (65.5%, a difference of 0.0%), Samoan (65.5%, a difference of 0.010%), Indian (Asian) (65.5%, a difference of 0.040%), Latvian (65.5%, a difference of 0.040%), and Immigrants from West Indies (65.6%, a difference of 0.050%).
| Demographics | Rating | Rank | In Labor Force | Age > 16 |
| Immigrants | Lithuania | 93.5 /100 | #133 | Exceptional 65.6% |
| Costa Ricans | 93.2 /100 | #134 | Exceptional 65.6% |
| Guatemalans | 92.5 /100 | #135 | Exceptional 65.6% |
| Immigrants | Argentina | 92.4 /100 | #136 | Exceptional 65.6% |
| Guamanians/Chamorros | 92.4 /100 | #137 | Exceptional 65.6% |
| Immigrants | West Indies | 92.0 /100 | #138 | Exceptional 65.6% |
| Immigrants | Taiwan | 90.8 /100 | #139 | Exceptional 65.5% |
| Immigrants | Costa Rica | 90.8 /100 | #140 | Exceptional 65.5% |
| Samoans | 90.5 /100 | #141 | Exceptional 65.5% |
| Indians (Asian) | 89.5 /100 | #142 | Excellent 65.5% |
| Latvians | 89.4 /100 | #143 | Excellent 65.5% |
| Immigrants | Romania | 88.6 /100 | #144 | Excellent 65.5% |
| Tlingit-Haida | 88.3 /100 | #145 | Excellent 65.5% |
| Cypriots | 88.2 /100 | #146 | Excellent 65.5% |
| Immigrants | Oceania | 87.5 /100 | #147 | Excellent 65.5% |