Immigrants from Belgium vs Immigrants from Costa Rica In Labor Force | Age > 16
COMPARE
Immigrants from Belgium
Immigrants from Costa Rica
In Labor Force | Age > 16
In Labor Force | Age > 16 Comparison
Immigrants from Belgium
Immigrants from Costa Rica
64.9%
IN LABOR FORCE | AGE > 16
19.4/ 100
METRIC RATING
202nd/ 347
METRIC RANK
65.5%
IN LABOR FORCE | AGE > 16
90.8/ 100
METRIC RATING
140th/ 347
METRIC RANK
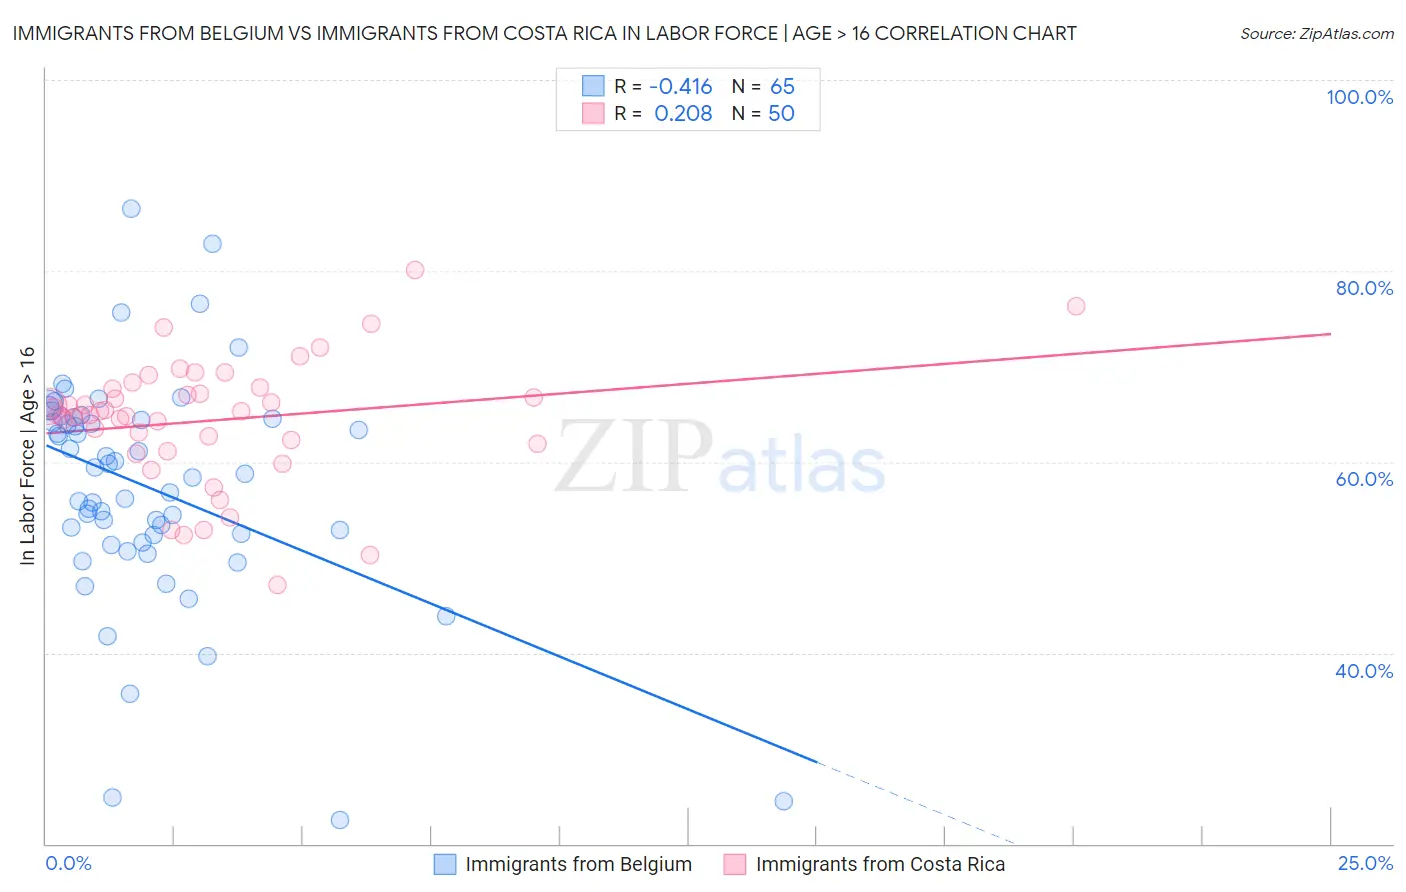
Immigrants from Belgium vs Immigrants from Costa Rica In Labor Force | Age > 16 Correlation Chart
The statistical analysis conducted on geographies consisting of 146,728,908 people shows a moderate negative correlation between the proportion of Immigrants from Belgium and labor force participation rate among population ages 16 and over in the United States with a correlation coefficient (R) of -0.416 and weighted average of 64.9%. Similarly, the statistical analysis conducted on geographies consisting of 204,275,671 people shows a weak positive correlation between the proportion of Immigrants from Costa Rica and labor force participation rate among population ages 16 and over in the United States with a correlation coefficient (R) of 0.208 and weighted average of 65.5%, a difference of 1.0%.
In Labor Force | Age > 16 Correlation Summary
| Measurement | Immigrants from Belgium | Immigrants from Costa Rica |
| Minimum | 22.5% | 47.1% |
| Maximum | 86.5% | 80.1% |
| Range | 64.0% | 33.0% |
| Mean | 57.3% | 64.3% |
| Median | 58.8% | 65.1% |
| Interquartile 25% (IQ1) | 52.0% | 61.9% |
| Interquartile 75% (IQ3) | 64.6% | 67.7% |
| Interquartile Range (IQR) | 12.6% | 5.8% |
| Standard Deviation (Sample) | 11.9% | 6.5% |
| Standard Deviation (Population) | 11.8% | 6.5% |
Similar Demographics by In Labor Force | Age > 16
Demographics Similar to Immigrants from Belgium by In Labor Force | Age > 16
In terms of in labor force | age > 16, the demographic groups most similar to Immigrants from Belgium are Ukrainian (64.9%, a difference of 0.0%), Russian (64.9%, a difference of 0.010%), Slovene (64.9%, a difference of 0.010%), Jamaican (64.9%, a difference of 0.010%), and Armenian (64.9%, a difference of 0.020%).
| Demographics | Rating | Rank | In Labor Force | Age > 16 |
| Romanians | 31.1 /100 | #195 | Fair 65.0% |
| Haitians | 30.6 /100 | #196 | Fair 65.0% |
| Immigrants | Italy | 28.7 /100 | #197 | Fair 65.0% |
| Greeks | 26.1 /100 | #198 | Fair 64.9% |
| Mexican American Indians | 23.1 /100 | #199 | Fair 64.9% |
| Armenians | 20.2 /100 | #200 | Fair 64.9% |
| Ukrainians | 19.6 /100 | #201 | Poor 64.9% |
| Immigrants | Belgium | 19.4 /100 | #202 | Poor 64.9% |
| Russians | 18.8 /100 | #203 | Poor 64.9% |
| Slovenes | 18.7 /100 | #204 | Poor 64.9% |
| Jamaicans | 18.7 /100 | #205 | Poor 64.9% |
| Lithuanians | 17.4 /100 | #206 | Poor 64.8% |
| Immigrants | Latin America | 16.4 /100 | #207 | Poor 64.8% |
| Belizeans | 16.2 /100 | #208 | Poor 64.8% |
| Immigrants | Trinidad and Tobago | 15.6 /100 | #209 | Poor 64.8% |
Demographics Similar to Immigrants from Costa Rica by In Labor Force | Age > 16
In terms of in labor force | age > 16, the demographic groups most similar to Immigrants from Costa Rica are Immigrants from Taiwan (65.5%, a difference of 0.0%), Samoan (65.5%, a difference of 0.010%), Indian (Asian) (65.5%, a difference of 0.040%), Latvian (65.5%, a difference of 0.040%), and Immigrants from West Indies (65.6%, a difference of 0.050%).
| Demographics | Rating | Rank | In Labor Force | Age > 16 |
| Immigrants | Lithuania | 93.5 /100 | #133 | Exceptional 65.6% |
| Costa Ricans | 93.2 /100 | #134 | Exceptional 65.6% |
| Guatemalans | 92.5 /100 | #135 | Exceptional 65.6% |
| Immigrants | Argentina | 92.4 /100 | #136 | Exceptional 65.6% |
| Guamanians/Chamorros | 92.4 /100 | #137 | Exceptional 65.6% |
| Immigrants | West Indies | 92.0 /100 | #138 | Exceptional 65.6% |
| Immigrants | Taiwan | 90.8 /100 | #139 | Exceptional 65.5% |
| Immigrants | Costa Rica | 90.8 /100 | #140 | Exceptional 65.5% |
| Samoans | 90.5 /100 | #141 | Exceptional 65.5% |
| Indians (Asian) | 89.5 /100 | #142 | Excellent 65.5% |
| Latvians | 89.4 /100 | #143 | Excellent 65.5% |
| Immigrants | Romania | 88.6 /100 | #144 | Excellent 65.5% |
| Tlingit-Haida | 88.3 /100 | #145 | Excellent 65.5% |
| Cypriots | 88.2 /100 | #146 | Excellent 65.5% |
| Immigrants | Oceania | 87.5 /100 | #147 | Excellent 65.5% |