German vs Latvian In Labor Force | Age > 16
COMPARE
German
Latvian
In Labor Force | Age > 16
In Labor Force | Age > 16 Comparison
Germans
Latvians
64.4%
IN LABOR FORCE | AGE > 16
1.8/ 100
METRIC RATING
249th/ 347
METRIC RANK
65.5%
IN LABOR FORCE | AGE > 16
89.4/ 100
METRIC RATING
143rd/ 347
METRIC RANK
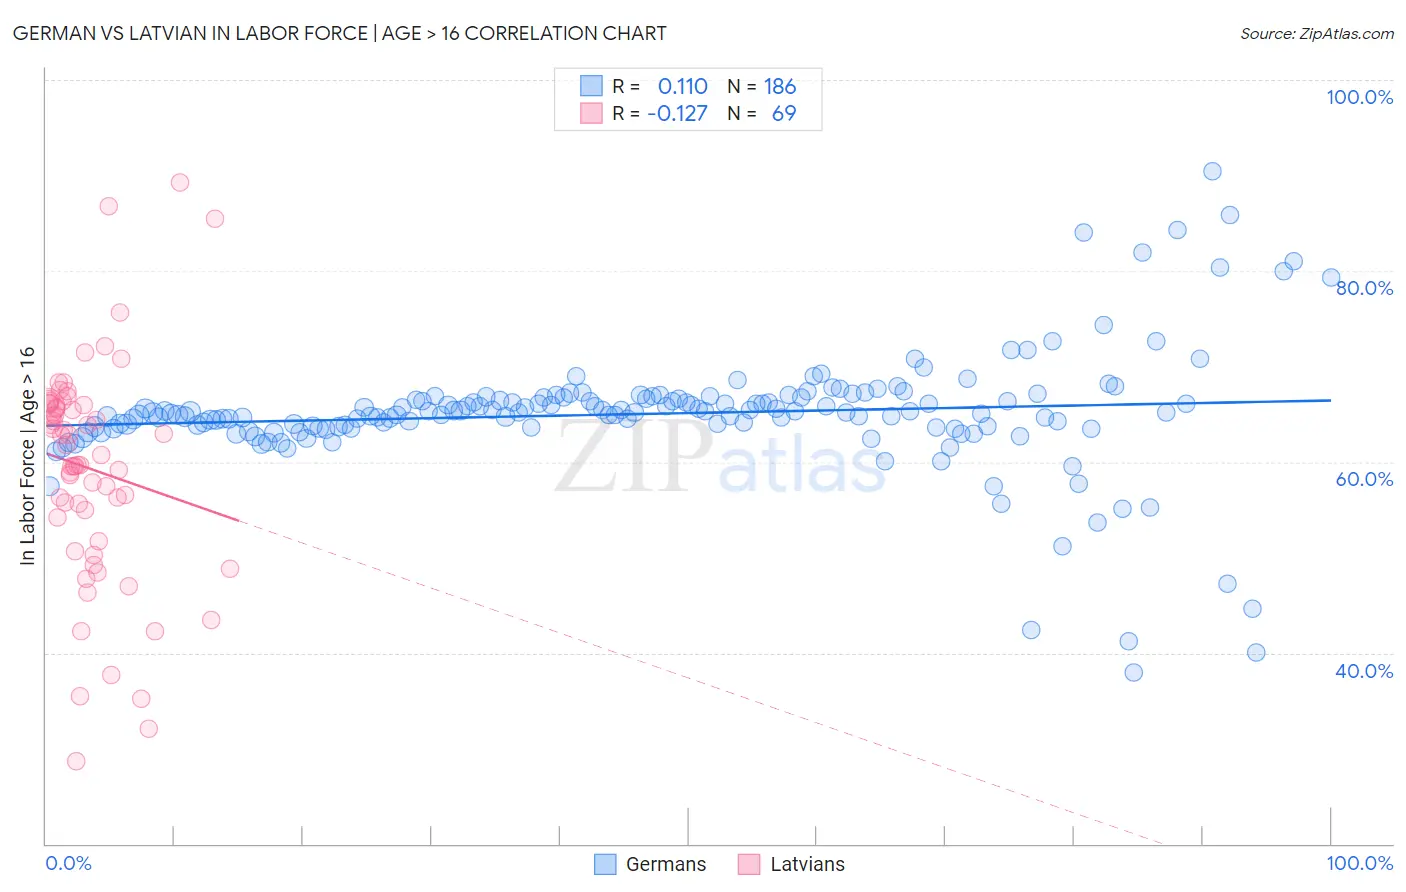
German vs Latvian In Labor Force | Age > 16 Correlation Chart
The statistical analysis conducted on geographies consisting of 581,290,926 people shows a poor positive correlation between the proportion of Germans and labor force participation rate among population ages 16 and over in the United States with a correlation coefficient (R) of 0.110 and weighted average of 64.4%. Similarly, the statistical analysis conducted on geographies consisting of 220,727,304 people shows a poor negative correlation between the proportion of Latvians and labor force participation rate among population ages 16 and over in the United States with a correlation coefficient (R) of -0.127 and weighted average of 65.5%, a difference of 1.7%.
In Labor Force | Age > 16 Correlation Summary
| Measurement | German | Latvian |
| Minimum | 37.9% | 28.6% |
| Maximum | 90.5% | 89.2% |
| Range | 52.6% | 60.6% |
| Mean | 65.0% | 59.3% |
| Median | 65.1% | 60.8% |
| Interquartile 25% (IQ1) | 63.6% | 52.9% |
| Interquartile 75% (IQ3) | 66.6% | 66.1% |
| Interquartile Range (IQR) | 3.0% | 13.2% |
| Standard Deviation (Sample) | 6.5% | 11.7% |
| Standard Deviation (Population) | 6.5% | 11.6% |
Similar Demographics by In Labor Force | Age > 16
Demographics Similar to Germans by In Labor Force | Age > 16
In terms of in labor force | age > 16, the demographic groups most similar to Germans are British West Indian (64.4%, a difference of 0.010%), Immigrants from Barbados (64.4%, a difference of 0.030%), Portuguese (64.4%, a difference of 0.030%), Swiss (64.4%, a difference of 0.040%), and Immigrants from Caribbean (64.4%, a difference of 0.060%).
| Demographics | Rating | Rank | In Labor Force | Age > 16 |
| Immigrants | Netherlands | 3.4 /100 | #242 | Tragic 64.5% |
| Immigrants | Lebanon | 3.2 /100 | #243 | Tragic 64.5% |
| Tsimshian | 3.1 /100 | #244 | Tragic 64.5% |
| West Indians | 3.0 /100 | #245 | Tragic 64.5% |
| Immigrants | Caribbean | 2.3 /100 | #246 | Tragic 64.4% |
| Swiss | 2.1 /100 | #247 | Tragic 64.4% |
| Immigrants | Barbados | 2.1 /100 | #248 | Tragic 64.4% |
| Germans | 1.8 /100 | #249 | Tragic 64.4% |
| British West Indians | 1.8 /100 | #250 | Tragic 64.4% |
| Portuguese | 1.6 /100 | #251 | Tragic 64.4% |
| Immigrants | Dominican Republic | 1.5 /100 | #252 | Tragic 64.4% |
| Czechoslovakians | 1.4 /100 | #253 | Tragic 64.3% |
| Immigrants | Uzbekistan | 1.4 /100 | #254 | Tragic 64.3% |
| Hispanics or Latinos | 1.1 /100 | #255 | Tragic 64.3% |
| Immigrants | Mexico | 1.0 /100 | #256 | Tragic 64.3% |
Demographics Similar to Latvians by In Labor Force | Age > 16
In terms of in labor force | age > 16, the demographic groups most similar to Latvians are Indian (Asian) (65.5%, a difference of 0.0%), Immigrants from Romania (65.5%, a difference of 0.020%), Samoan (65.5%, a difference of 0.030%), Tlingit-Haida (65.5%, a difference of 0.030%), and Immigrants from Taiwan (65.5%, a difference of 0.040%).
| Demographics | Rating | Rank | In Labor Force | Age > 16 |
| Immigrants | Argentina | 92.4 /100 | #136 | Exceptional 65.6% |
| Guamanians/Chamorros | 92.4 /100 | #137 | Exceptional 65.6% |
| Immigrants | West Indies | 92.0 /100 | #138 | Exceptional 65.6% |
| Immigrants | Taiwan | 90.8 /100 | #139 | Exceptional 65.5% |
| Immigrants | Costa Rica | 90.8 /100 | #140 | Exceptional 65.5% |
| Samoans | 90.5 /100 | #141 | Exceptional 65.5% |
| Indians (Asian) | 89.5 /100 | #142 | Excellent 65.5% |
| Latvians | 89.4 /100 | #143 | Excellent 65.5% |
| Immigrants | Romania | 88.6 /100 | #144 | Excellent 65.5% |
| Tlingit-Haida | 88.3 /100 | #145 | Excellent 65.5% |
| Cypriots | 88.2 /100 | #146 | Excellent 65.5% |
| Immigrants | Oceania | 87.5 /100 | #147 | Excellent 65.5% |
| Bhutanese | 86.3 /100 | #148 | Excellent 65.5% |
| Immigrants | Albania | 85.7 /100 | #149 | Excellent 65.4% |
| Immigrants | Immigrants | 81.9 /100 | #150 | Excellent 65.4% |