German vs Immigrants from Brazil In Labor Force | Age > 16
COMPARE
German
Immigrants from Brazil
In Labor Force | Age > 16
In Labor Force | Age > 16 Comparison
Germans
Immigrants from Brazil
64.4%
IN LABOR FORCE | AGE > 16
1.8/ 100
METRIC RATING
249th/ 347
METRIC RANK
66.7%
IN LABOR FORCE | AGE > 16
100.0/ 100
METRIC RATING
45th/ 347
METRIC RANK
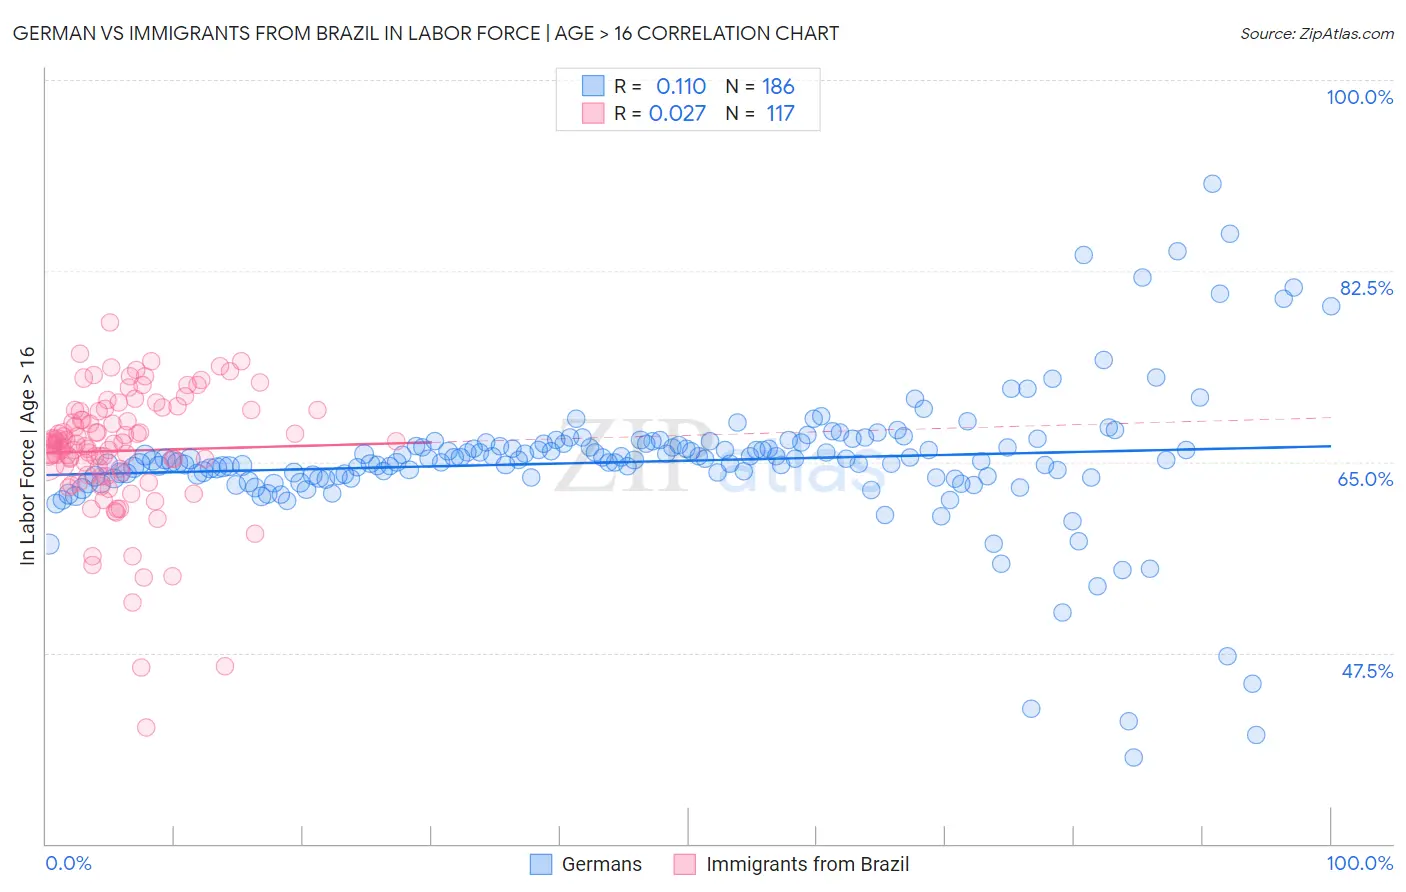
German vs Immigrants from Brazil In Labor Force | Age > 16 Correlation Chart
The statistical analysis conducted on geographies consisting of 581,290,926 people shows a poor positive correlation between the proportion of Germans and labor force participation rate among population ages 16 and over in the United States with a correlation coefficient (R) of 0.110 and weighted average of 64.4%. Similarly, the statistical analysis conducted on geographies consisting of 343,023,215 people shows no correlation between the proportion of Immigrants from Brazil and labor force participation rate among population ages 16 and over in the United States with a correlation coefficient (R) of 0.027 and weighted average of 66.7%, a difference of 3.5%.
In Labor Force | Age > 16 Correlation Summary
| Measurement | German | Immigrants from Brazil |
| Minimum | 37.9% | 40.7% |
| Maximum | 90.5% | 77.8% |
| Range | 52.6% | 37.1% |
| Mean | 65.0% | 66.0% |
| Median | 65.1% | 66.6% |
| Interquartile 25% (IQ1) | 63.6% | 63.9% |
| Interquartile 75% (IQ3) | 66.6% | 69.7% |
| Interquartile Range (IQR) | 3.0% | 5.8% |
| Standard Deviation (Sample) | 6.5% | 5.8% |
| Standard Deviation (Population) | 6.5% | 5.8% |
Similar Demographics by In Labor Force | Age > 16
Demographics Similar to Germans by In Labor Force | Age > 16
In terms of in labor force | age > 16, the demographic groups most similar to Germans are British West Indian (64.4%, a difference of 0.010%), Immigrants from Barbados (64.4%, a difference of 0.030%), Portuguese (64.4%, a difference of 0.030%), Swiss (64.4%, a difference of 0.040%), and Immigrants from Caribbean (64.4%, a difference of 0.060%).
| Demographics | Rating | Rank | In Labor Force | Age > 16 |
| Immigrants | Netherlands | 3.4 /100 | #242 | Tragic 64.5% |
| Immigrants | Lebanon | 3.2 /100 | #243 | Tragic 64.5% |
| Tsimshian | 3.1 /100 | #244 | Tragic 64.5% |
| West Indians | 3.0 /100 | #245 | Tragic 64.5% |
| Immigrants | Caribbean | 2.3 /100 | #246 | Tragic 64.4% |
| Swiss | 2.1 /100 | #247 | Tragic 64.4% |
| Immigrants | Barbados | 2.1 /100 | #248 | Tragic 64.4% |
| Germans | 1.8 /100 | #249 | Tragic 64.4% |
| British West Indians | 1.8 /100 | #250 | Tragic 64.4% |
| Portuguese | 1.6 /100 | #251 | Tragic 64.4% |
| Immigrants | Dominican Republic | 1.5 /100 | #252 | Tragic 64.4% |
| Czechoslovakians | 1.4 /100 | #253 | Tragic 64.3% |
| Immigrants | Uzbekistan | 1.4 /100 | #254 | Tragic 64.3% |
| Hispanics or Latinos | 1.1 /100 | #255 | Tragic 64.3% |
| Immigrants | Mexico | 1.0 /100 | #256 | Tragic 64.3% |
Demographics Similar to Immigrants from Brazil by In Labor Force | Age > 16
In terms of in labor force | age > 16, the demographic groups most similar to Immigrants from Brazil are Immigrants from Pakistan (66.7%, a difference of 0.050%), Brazilian (66.6%, a difference of 0.070%), Immigrants from Bulgaria (66.6%, a difference of 0.070%), Nigerian (66.6%, a difference of 0.080%), and Luxembourger (66.7%, a difference of 0.10%).
| Demographics | Rating | Rank | In Labor Force | Age > 16 |
| Immigrants | Nigeria | 100.0 /100 | #38 | Exceptional 66.9% |
| Salvadorans | 100.0 /100 | #39 | Exceptional 66.8% |
| Immigrants | El Salvador | 100.0 /100 | #40 | Exceptional 66.8% |
| Immigrants | Zimbabwe | 100.0 /100 | #41 | Exceptional 66.8% |
| Senegalese | 100.0 /100 | #42 | Exceptional 66.7% |
| Luxembourgers | 100.0 /100 | #43 | Exceptional 66.7% |
| Immigrants | Pakistan | 100.0 /100 | #44 | Exceptional 66.7% |
| Immigrants | Brazil | 100.0 /100 | #45 | Exceptional 66.7% |
| Brazilians | 100.0 /100 | #46 | Exceptional 66.6% |
| Immigrants | Bulgaria | 100.0 /100 | #47 | Exceptional 66.6% |
| Nigerians | 100.0 /100 | #48 | Exceptional 66.6% |
| Immigrants | Northern Africa | 100.0 /100 | #49 | Exceptional 66.6% |
| Cape Verdeans | 100.0 /100 | #50 | Exceptional 66.6% |
| Immigrants | Kuwait | 100.0 /100 | #51 | Exceptional 66.5% |
| Paraguayans | 99.9 /100 | #52 | Exceptional 66.5% |