German vs Immigrants from Bahamas In Labor Force | Age > 16
COMPARE
German
Immigrants from Bahamas
In Labor Force | Age > 16
In Labor Force | Age > 16 Comparison
Germans
Immigrants from Bahamas
64.4%
IN LABOR FORCE | AGE > 16
1.8/ 100
METRIC RATING
249th/ 347
METRIC RANK
64.0%
IN LABOR FORCE | AGE > 16
0.3/ 100
METRIC RATING
277th/ 347
METRIC RANK
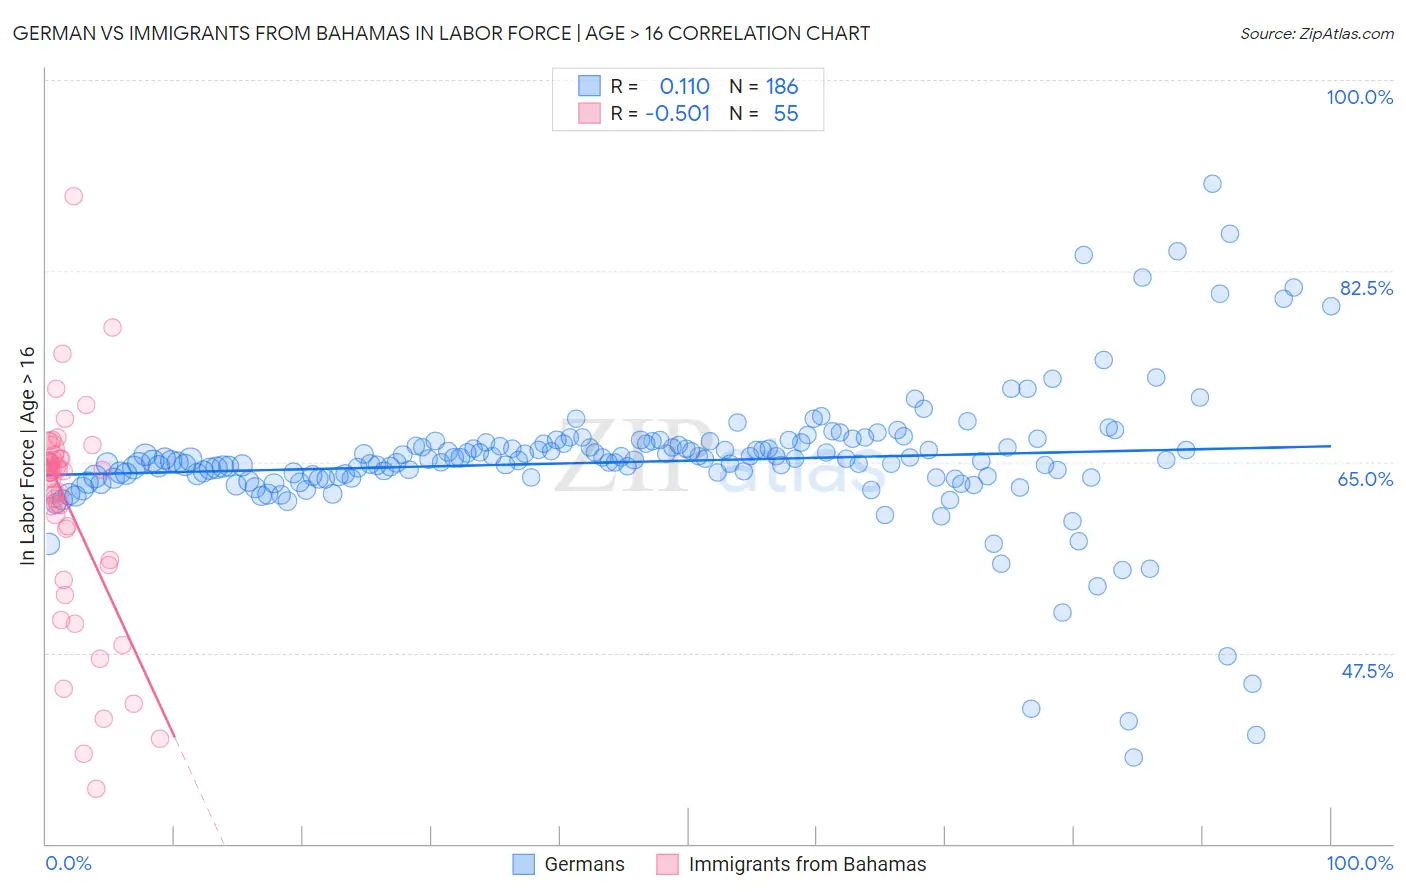
German vs Immigrants from Bahamas In Labor Force | Age > 16 Correlation Chart
The statistical analysis conducted on geographies consisting of 581,290,926 people shows a poor positive correlation between the proportion of Germans and labor force participation rate among population ages 16 and over in the United States with a correlation coefficient (R) of 0.110 and weighted average of 64.4%. Similarly, the statistical analysis conducted on geographies consisting of 104,666,072 people shows a substantial negative correlation between the proportion of Immigrants from Bahamas and labor force participation rate among population ages 16 and over in the United States with a correlation coefficient (R) of -0.501 and weighted average of 64.0%, a difference of 0.54%.
In Labor Force | Age > 16 Correlation Summary
| Measurement | German | Immigrants from Bahamas |
| Minimum | 37.9% | 35.0% |
| Maximum | 90.5% | 89.3% |
| Range | 52.6% | 54.3% |
| Mean | 65.0% | 60.8% |
| Median | 65.1% | 64.0% |
| Interquartile 25% (IQ1) | 63.6% | 56.0% |
| Interquartile 75% (IQ3) | 66.6% | 65.3% |
| Interquartile Range (IQR) | 3.0% | 9.3% |
| Standard Deviation (Sample) | 6.5% | 10.0% |
| Standard Deviation (Population) | 6.5% | 9.9% |
Similar Demographics by In Labor Force | Age > 16
Demographics Similar to Germans by In Labor Force | Age > 16
In terms of in labor force | age > 16, the demographic groups most similar to Germans are British West Indian (64.4%, a difference of 0.010%), Immigrants from Barbados (64.4%, a difference of 0.030%), Portuguese (64.4%, a difference of 0.030%), Swiss (64.4%, a difference of 0.040%), and Immigrants from Caribbean (64.4%, a difference of 0.060%).
| Demographics | Rating | Rank | In Labor Force | Age > 16 |
| Immigrants | Netherlands | 3.4 /100 | #242 | Tragic 64.5% |
| Immigrants | Lebanon | 3.2 /100 | #243 | Tragic 64.5% |
| Tsimshian | 3.1 /100 | #244 | Tragic 64.5% |
| West Indians | 3.0 /100 | #245 | Tragic 64.5% |
| Immigrants | Caribbean | 2.3 /100 | #246 | Tragic 64.4% |
| Swiss | 2.1 /100 | #247 | Tragic 64.4% |
| Immigrants | Barbados | 2.1 /100 | #248 | Tragic 64.4% |
| Germans | 1.8 /100 | #249 | Tragic 64.4% |
| British West Indians | 1.8 /100 | #250 | Tragic 64.4% |
| Portuguese | 1.6 /100 | #251 | Tragic 64.4% |
| Immigrants | Dominican Republic | 1.5 /100 | #252 | Tragic 64.4% |
| Czechoslovakians | 1.4 /100 | #253 | Tragic 64.3% |
| Immigrants | Uzbekistan | 1.4 /100 | #254 | Tragic 64.3% |
| Hispanics or Latinos | 1.1 /100 | #255 | Tragic 64.3% |
| Immigrants | Mexico | 1.0 /100 | #256 | Tragic 64.3% |
Demographics Similar to Immigrants from Bahamas by In Labor Force | Age > 16
In terms of in labor force | age > 16, the demographic groups most similar to Immigrants from Bahamas are Assyrian/Chaldean/Syriac (64.0%, a difference of 0.020%), Immigrants from Cuba (64.1%, a difference of 0.030%), Mexican (64.1%, a difference of 0.030%), French American Indian (64.1%, a difference of 0.030%), and Native Hawaiian (64.1%, a difference of 0.050%).
| Demographics | Rating | Rank | In Labor Force | Age > 16 |
| Guyanese | 0.4 /100 | #270 | Tragic 64.1% |
| Dominicans | 0.4 /100 | #271 | Tragic 64.1% |
| Native Hawaiians | 0.3 /100 | #272 | Tragic 64.1% |
| Hmong | 0.3 /100 | #273 | Tragic 64.1% |
| Immigrants | Cuba | 0.3 /100 | #274 | Tragic 64.1% |
| Mexicans | 0.3 /100 | #275 | Tragic 64.1% |
| French American Indians | 0.3 /100 | #276 | Tragic 64.1% |
| Immigrants | Bahamas | 0.3 /100 | #277 | Tragic 64.0% |
| Assyrians/Chaldeans/Syriacs | 0.3 /100 | #278 | Tragic 64.0% |
| Welsh | 0.2 /100 | #279 | Tragic 64.0% |
| Immigrants | St. Vincent and the Grenadines | 0.2 /100 | #280 | Tragic 64.0% |
| French Canadians | 0.2 /100 | #281 | Tragic 64.0% |
| Immigrants | Guyana | 0.2 /100 | #282 | Tragic 64.0% |
| Immigrants | Germany | 0.1 /100 | #283 | Tragic 63.9% |
| French | 0.1 /100 | #284 | Tragic 63.9% |