Immigrants from Portugal vs Latvian In Labor Force | Age > 16
COMPARE
Immigrants from Portugal
Latvian
In Labor Force | Age > 16
In Labor Force | Age > 16 Comparison
Immigrants from Portugal
Latvians
65.0%
IN LABOR FORCE | AGE > 16
34.8/ 100
METRIC RATING
188th/ 347
METRIC RANK
65.5%
IN LABOR FORCE | AGE > 16
89.4/ 100
METRIC RATING
143rd/ 347
METRIC RANK
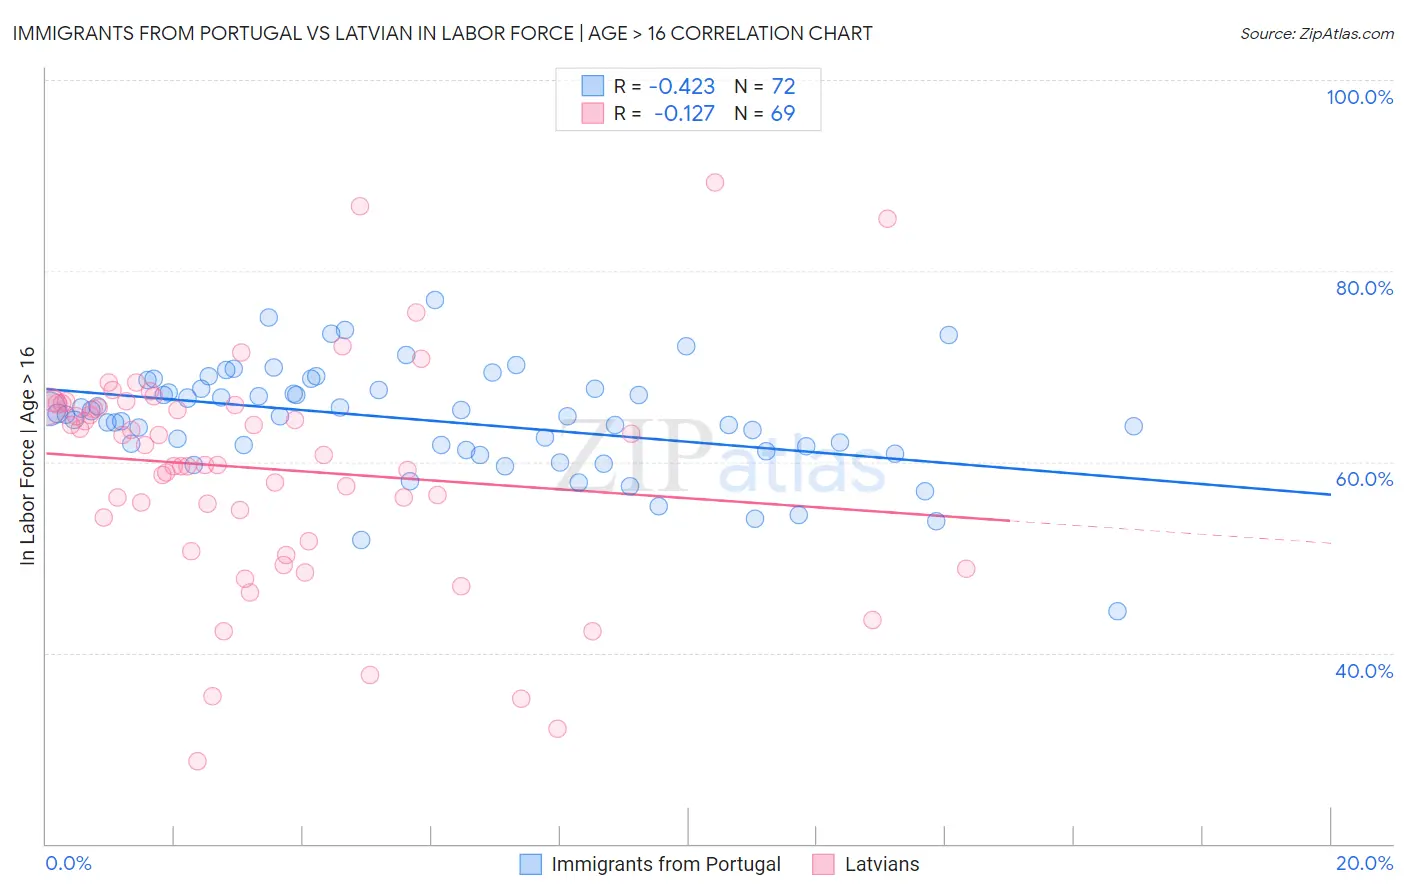
Immigrants from Portugal vs Latvian In Labor Force | Age > 16 Correlation Chart
The statistical analysis conducted on geographies consisting of 174,779,205 people shows a moderate negative correlation between the proportion of Immigrants from Portugal and labor force participation rate among population ages 16 and over in the United States with a correlation coefficient (R) of -0.423 and weighted average of 65.0%. Similarly, the statistical analysis conducted on geographies consisting of 220,727,304 people shows a poor negative correlation between the proportion of Latvians and labor force participation rate among population ages 16 and over in the United States with a correlation coefficient (R) of -0.127 and weighted average of 65.5%, a difference of 0.78%.
In Labor Force | Age > 16 Correlation Summary
| Measurement | Immigrants from Portugal | Latvian |
| Minimum | 44.4% | 28.6% |
| Maximum | 76.9% | 89.2% |
| Range | 32.5% | 60.6% |
| Mean | 64.4% | 59.3% |
| Median | 64.9% | 60.8% |
| Interquartile 25% (IQ1) | 61.5% | 52.9% |
| Interquartile 75% (IQ3) | 67.6% | 66.1% |
| Interquartile Range (IQR) | 6.2% | 13.2% |
| Standard Deviation (Sample) | 5.7% | 11.7% |
| Standard Deviation (Population) | 5.6% | 11.6% |
Similar Demographics by In Labor Force | Age > 16
Demographics Similar to Immigrants from Portugal by In Labor Force | Age > 16
In terms of in labor force | age > 16, the demographic groups most similar to Immigrants from Portugal are Immigrants from Croatia (65.0%, a difference of 0.010%), Immigrants from Greece (65.0%, a difference of 0.010%), Barbadian (65.0%, a difference of 0.010%), Scandinavian (65.0%, a difference of 0.010%), and Immigrants from Fiji (65.0%, a difference of 0.010%).
| Demographics | Rating | Rank | In Labor Force | Age > 16 |
| Immigrants | Panama | 42.4 /100 | #181 | Average 65.1% |
| Immigrants | Nicaragua | 41.1 /100 | #182 | Average 65.1% |
| Soviet Union | 40.5 /100 | #183 | Average 65.0% |
| Carpatho Rusyns | 40.0 /100 | #184 | Average 65.0% |
| Syrians | 40.0 /100 | #185 | Average 65.0% |
| Immigrants | Switzerland | 38.2 /100 | #186 | Fair 65.0% |
| Immigrants | Croatia | 35.7 /100 | #187 | Fair 65.0% |
| Immigrants | Portugal | 34.8 /100 | #188 | Fair 65.0% |
| Immigrants | Greece | 34.3 /100 | #189 | Fair 65.0% |
| Barbadians | 33.9 /100 | #190 | Fair 65.0% |
| Scandinavians | 33.7 /100 | #191 | Fair 65.0% |
| Immigrants | Fiji | 33.7 /100 | #192 | Fair 65.0% |
| Immigrants | Europe | 33.6 /100 | #193 | Fair 65.0% |
| Immigrants | Southern Europe | 31.3 /100 | #194 | Fair 65.0% |
| Romanians | 31.1 /100 | #195 | Fair 65.0% |
Demographics Similar to Latvians by In Labor Force | Age > 16
In terms of in labor force | age > 16, the demographic groups most similar to Latvians are Indian (Asian) (65.5%, a difference of 0.0%), Immigrants from Romania (65.5%, a difference of 0.020%), Samoan (65.5%, a difference of 0.030%), Tlingit-Haida (65.5%, a difference of 0.030%), and Immigrants from Taiwan (65.5%, a difference of 0.040%).
| Demographics | Rating | Rank | In Labor Force | Age > 16 |
| Immigrants | Argentina | 92.4 /100 | #136 | Exceptional 65.6% |
| Guamanians/Chamorros | 92.4 /100 | #137 | Exceptional 65.6% |
| Immigrants | West Indies | 92.0 /100 | #138 | Exceptional 65.6% |
| Immigrants | Taiwan | 90.8 /100 | #139 | Exceptional 65.5% |
| Immigrants | Costa Rica | 90.8 /100 | #140 | Exceptional 65.5% |
| Samoans | 90.5 /100 | #141 | Exceptional 65.5% |
| Indians (Asian) | 89.5 /100 | #142 | Excellent 65.5% |
| Latvians | 89.4 /100 | #143 | Excellent 65.5% |
| Immigrants | Romania | 88.6 /100 | #144 | Excellent 65.5% |
| Tlingit-Haida | 88.3 /100 | #145 | Excellent 65.5% |
| Cypriots | 88.2 /100 | #146 | Excellent 65.5% |
| Immigrants | Oceania | 87.5 /100 | #147 | Excellent 65.5% |
| Bhutanese | 86.3 /100 | #148 | Excellent 65.5% |
| Immigrants | Albania | 85.7 /100 | #149 | Excellent 65.4% |
| Immigrants | Immigrants | 81.9 /100 | #150 | Excellent 65.4% |