German vs Latvian Unemployment Among Ages 30 to 34 years
COMPARE
German
Latvian
Unemployment Among Ages 30 to 34 years
Unemployment Among Ages 30 to 34 years Comparison
Germans
Latvians
5.3%
UNEMPLOYMENT AMONG AGES 30 TO 34 YEARS
77.8/ 100
METRIC RATING
130th/ 347
METRIC RANK
5.0%
UNEMPLOYMENT AMONG AGES 30 TO 34 YEARS
99.3/ 100
METRIC RATING
34th/ 347
METRIC RANK
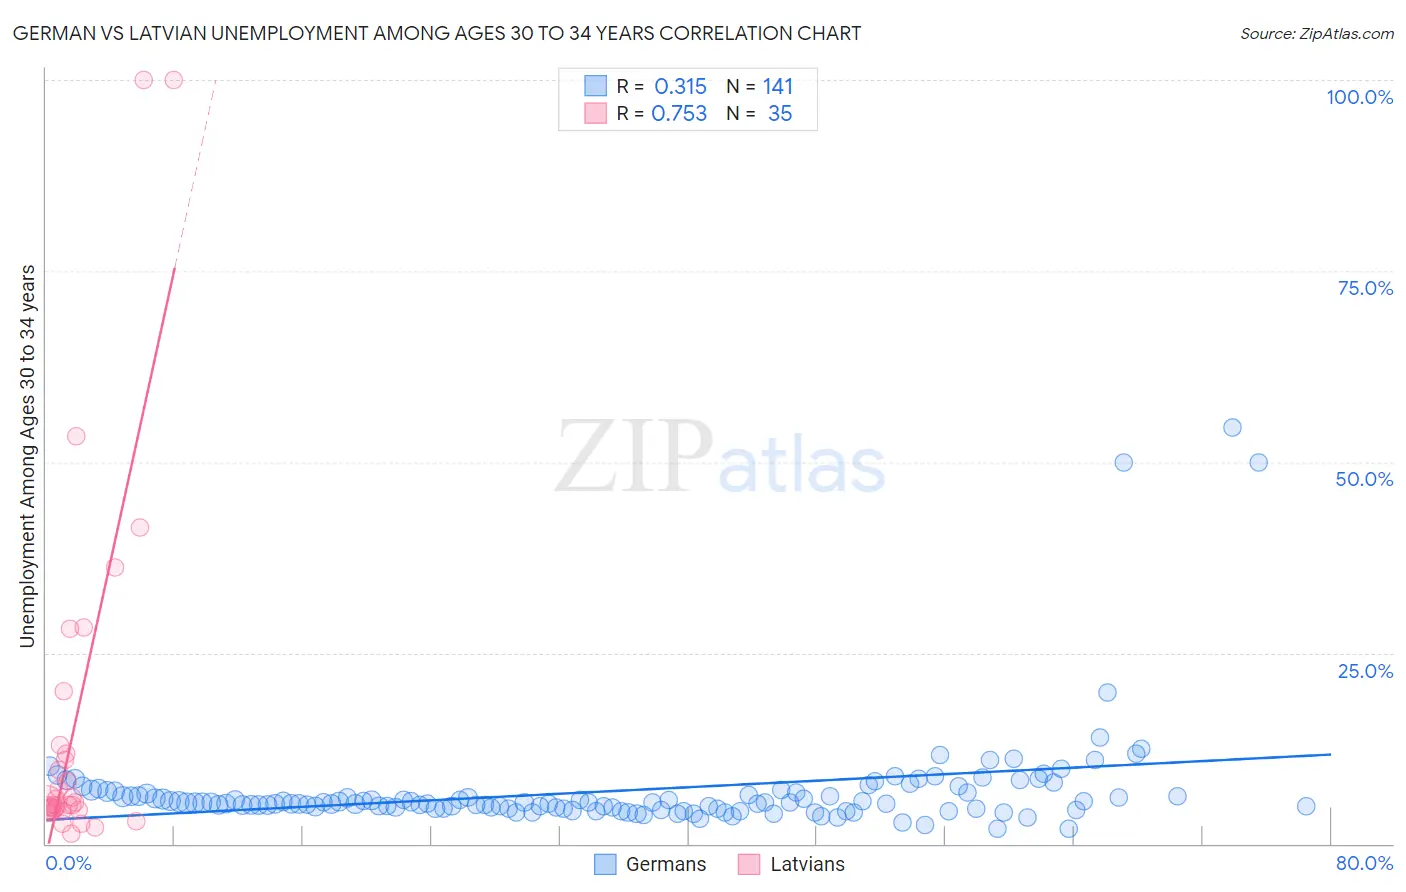
German vs Latvian Unemployment Among Ages 30 to 34 years Correlation Chart
The statistical analysis conducted on geographies consisting of 502,645,862 people shows a mild positive correlation between the proportion of Germans and unemployment rate among population between the ages 30 and 34 in the United States with a correlation coefficient (R) of 0.315 and weighted average of 5.3%. Similarly, the statistical analysis conducted on geographies consisting of 211,593,326 people shows a strong positive correlation between the proportion of Latvians and unemployment rate among population between the ages 30 and 34 in the United States with a correlation coefficient (R) of 0.753 and weighted average of 5.0%, a difference of 6.9%.
Unemployment Among Ages 30 to 34 years Correlation Summary
| Measurement | German | Latvian |
| Minimum | 1.9% | 1.2% |
| Maximum | 54.5% | 100.0% |
| Range | 52.6% | 98.8% |
| Mean | 6.9% | 15.9% |
| Median | 5.3% | 5.2% |
| Interquartile 25% (IQ1) | 4.6% | 4.4% |
| Interquartile 75% (IQ3) | 6.8% | 12.9% |
| Interquartile Range (IQR) | 2.2% | 8.4% |
| Standard Deviation (Sample) | 7.0% | 24.3% |
| Standard Deviation (Population) | 7.0% | 23.9% |
Similar Demographics by Unemployment Among Ages 30 to 34 years
Demographics Similar to Germans by Unemployment Among Ages 30 to 34 years
In terms of unemployment among ages 30 to 34 years, the demographic groups most similar to Germans are Immigrants from Eastern Europe (5.3%, a difference of 0.040%), Carpatho Rusyn (5.3%, a difference of 0.050%), Immigrants from Northern Europe (5.3%, a difference of 0.050%), Polish (5.3%, a difference of 0.10%), and Bangladeshi (5.3%, a difference of 0.12%).
| Demographics | Rating | Rank | Unemployment Among Ages 30 to 34 years |
| Immigrants | Italy | 81.1 /100 | #123 | Excellent 5.3% |
| Immigrants | Brazil | 80.8 /100 | #124 | Excellent 5.3% |
| Greeks | 80.4 /100 | #125 | Excellent 5.3% |
| Immigrants | Sri Lanka | 80.2 /100 | #126 | Excellent 5.3% |
| Taiwanese | 79.4 /100 | #127 | Good 5.3% |
| Immigrants | Uruguay | 79.3 /100 | #128 | Good 5.3% |
| Poles | 78.8 /100 | #129 | Good 5.3% |
| Germans | 77.8 /100 | #130 | Good 5.3% |
| Immigrants | Eastern Europe | 77.4 /100 | #131 | Good 5.3% |
| Carpatho Rusyns | 77.3 /100 | #132 | Good 5.3% |
| Immigrants | Northern Europe | 77.3 /100 | #133 | Good 5.3% |
| Bangladeshis | 76.6 /100 | #134 | Good 5.3% |
| Palestinians | 75.1 /100 | #135 | Good 5.4% |
| Pakistanis | 74.6 /100 | #136 | Good 5.4% |
| Immigrants | Canada | 74.6 /100 | #137 | Good 5.4% |
Demographics Similar to Latvians by Unemployment Among Ages 30 to 34 years
In terms of unemployment among ages 30 to 34 years, the demographic groups most similar to Latvians are Immigrants from Saudi Arabia (5.0%, a difference of 0.050%), Immigrants from Zaire (5.0%, a difference of 0.14%), Somali (5.0%, a difference of 0.19%), Immigrants from Ethiopia (5.0%, a difference of 0.23%), and Norwegian (5.0%, a difference of 0.28%).
| Demographics | Rating | Rank | Unemployment Among Ages 30 to 34 years |
| Danes | 99.5 /100 | #27 | Exceptional 5.0% |
| Immigrants | Cuba | 99.4 /100 | #28 | Exceptional 5.0% |
| German Russians | 99.4 /100 | #29 | Exceptional 5.0% |
| Norwegians | 99.4 /100 | #30 | Exceptional 5.0% |
| Somalis | 99.3 /100 | #31 | Exceptional 5.0% |
| Immigrants | Zaire | 99.3 /100 | #32 | Exceptional 5.0% |
| Immigrants | Saudi Arabia | 99.3 /100 | #33 | Exceptional 5.0% |
| Latvians | 99.3 /100 | #34 | Exceptional 5.0% |
| Immigrants | Ethiopia | 99.2 /100 | #35 | Exceptional 5.0% |
| Czechs | 99.2 /100 | #36 | Exceptional 5.0% |
| Immigrants | Turkey | 99.0 /100 | #37 | Exceptional 5.0% |
| Sri Lankans | 99.0 /100 | #38 | Exceptional 5.0% |
| Fijians | 99.0 /100 | #39 | Exceptional 5.0% |
| Immigrants | Vietnam | 98.9 /100 | #40 | Exceptional 5.0% |
| Immigrants | Eastern Africa | 98.9 /100 | #41 | Exceptional 5.0% |