German vs Latvian Child Poverty Under the Age of 16
COMPARE
German
Latvian
Child Poverty Under the Age of 16
Child Poverty Under the Age of 16 Comparison
Germans
Latvians
14.5%
CHILD POVERTY UNDER THE AGE OF 16
96.9/ 100
METRIC RATING
89th/ 347
METRIC RANK
13.2%
CHILD POVERTY UNDER THE AGE OF 16
99.8/ 100
METRIC RATING
24th/ 347
METRIC RANK
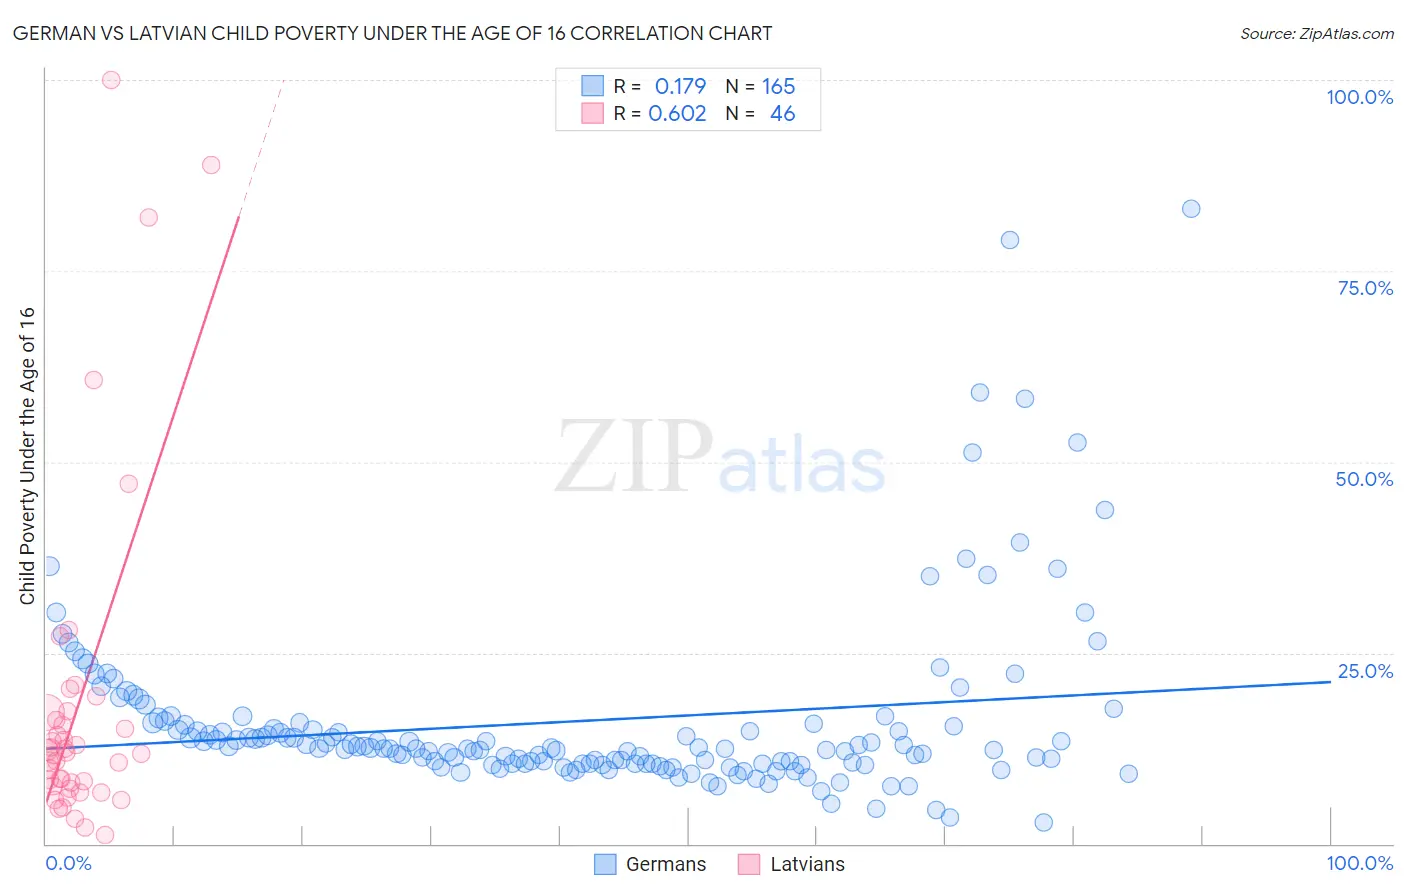
German vs Latvian Child Poverty Under the Age of 16 Correlation Chart
The statistical analysis conducted on geographies consisting of 566,271,937 people shows a poor positive correlation between the proportion of Germans and poverty level among children under the age of 16 in the United States with a correlation coefficient (R) of 0.179 and weighted average of 14.5%. Similarly, the statistical analysis conducted on geographies consisting of 218,902,894 people shows a significant positive correlation between the proportion of Latvians and poverty level among children under the age of 16 in the United States with a correlation coefficient (R) of 0.602 and weighted average of 13.2%, a difference of 10.3%.
Child Poverty Under the Age of 16 Correlation Summary
| Measurement | German | Latvian |
| Minimum | 2.8% | 1.1% |
| Maximum | 83.1% | 100.0% |
| Range | 80.4% | 98.9% |
| Mean | 16.1% | 18.4% |
| Median | 12.5% | 11.8% |
| Interquartile 25% (IQ1) | 10.4% | 7.5% |
| Interquartile 75% (IQ3) | 15.8% | 17.3% |
| Interquartile Range (IQR) | 5.4% | 9.7% |
| Standard Deviation (Sample) | 11.8% | 22.0% |
| Standard Deviation (Population) | 11.7% | 21.7% |
Similar Demographics by Child Poverty Under the Age of 16
Demographics Similar to Germans by Child Poverty Under the Age of 16
In terms of child poverty under the age of 16, the demographic groups most similar to Germans are Northern European (14.5%, a difference of 0.050%), Austrian (14.5%, a difference of 0.060%), Taiwanese (14.5%, a difference of 0.15%), Immigrants from Argentina (14.5%, a difference of 0.16%), and Soviet Union (14.5%, a difference of 0.23%).
| Demographics | Rating | Rank | Child Poverty Under the Age of 16 |
| Immigrants | Canada | 97.2 /100 | #82 | Exceptional 14.5% |
| Egyptians | 97.2 /100 | #83 | Exceptional 14.5% |
| Immigrants | Latvia | 97.1 /100 | #84 | Exceptional 14.5% |
| Soviet Union | 97.1 /100 | #85 | Exceptional 14.5% |
| Immigrants | Argentina | 97.1 /100 | #86 | Exceptional 14.5% |
| Taiwanese | 97.1 /100 | #87 | Exceptional 14.5% |
| Northern Europeans | 97.0 /100 | #88 | Exceptional 14.5% |
| Germans | 96.9 /100 | #89 | Exceptional 14.5% |
| Austrians | 96.9 /100 | #90 | Exceptional 14.5% |
| Immigrants | North America | 96.7 /100 | #91 | Exceptional 14.6% |
| Immigrants | Italy | 96.7 /100 | #92 | Exceptional 14.6% |
| Argentineans | 96.6 /100 | #93 | Exceptional 14.6% |
| Immigrants | South Africa | 96.3 /100 | #94 | Exceptional 14.6% |
| Immigrants | Croatia | 96.1 /100 | #95 | Exceptional 14.6% |
| Immigrants | France | 95.8 /100 | #96 | Exceptional 14.7% |
Demographics Similar to Latvians by Child Poverty Under the Age of 16
In terms of child poverty under the age of 16, the demographic groups most similar to Latvians are Eastern European (13.2%, a difference of 0.080%), Indian (Asian) (13.1%, a difference of 0.21%), Maltese (13.1%, a difference of 0.25%), Immigrants from Eastern Asia (13.1%, a difference of 0.33%), and Okinawan (13.1%, a difference of 0.36%).
| Demographics | Rating | Rank | Child Poverty Under the Age of 16 |
| Bulgarians | 99.9 /100 | #17 | Exceptional 13.0% |
| Cypriots | 99.9 /100 | #18 | Exceptional 13.0% |
| Immigrants | Japan | 99.8 /100 | #19 | Exceptional 13.0% |
| Okinawans | 99.8 /100 | #20 | Exceptional 13.1% |
| Immigrants | Eastern Asia | 99.8 /100 | #21 | Exceptional 13.1% |
| Maltese | 99.8 /100 | #22 | Exceptional 13.1% |
| Indians (Asian) | 99.8 /100 | #23 | Exceptional 13.1% |
| Latvians | 99.8 /100 | #24 | Exceptional 13.2% |
| Eastern Europeans | 99.8 /100 | #25 | Exceptional 13.2% |
| Bolivians | 99.8 /100 | #26 | Exceptional 13.2% |
| Immigrants | China | 99.8 /100 | #27 | Exceptional 13.3% |
| Assyrians/Chaldeans/Syriacs | 99.7 /100 | #28 | Exceptional 13.3% |
| Swedes | 99.7 /100 | #29 | Exceptional 13.3% |
| Turks | 99.7 /100 | #30 | Exceptional 13.4% |
| Danes | 99.7 /100 | #31 | Exceptional 13.4% |