Fijian vs Immigrants from Honduras In Labor Force | Age 35-44
COMPARE
Fijian
Immigrants from Honduras
In Labor Force | Age 35-44
In Labor Force | Age 35-44 Comparison
Fijians
Immigrants from Honduras
82.9%
IN LABOR FORCE | AGE 35-44
0.0/ 100
METRIC RATING
285th/ 347
METRIC RANK
83.3%
IN LABOR FORCE | AGE 35-44
0.0/ 100
METRIC RATING
270th/ 347
METRIC RANK
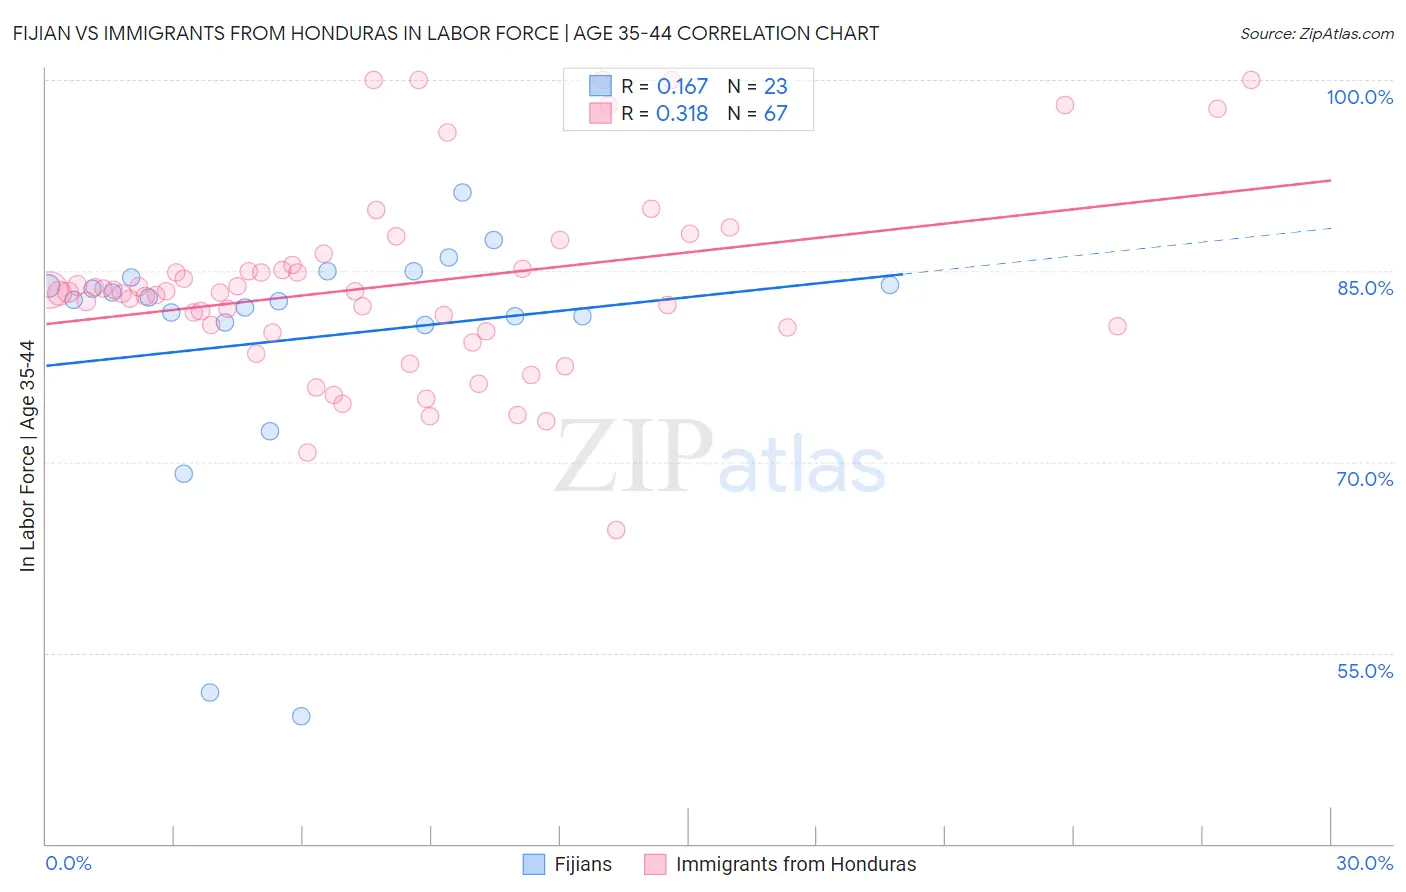
Fijian vs Immigrants from Honduras In Labor Force | Age 35-44 Correlation Chart
The statistical analysis conducted on geographies consisting of 55,946,572 people shows a poor positive correlation between the proportion of Fijians and labor force participation rate among population between the ages 35 and 44 in the United States with a correlation coefficient (R) of 0.167 and weighted average of 82.9%. Similarly, the statistical analysis conducted on geographies consisting of 322,503,020 people shows a mild positive correlation between the proportion of Immigrants from Honduras and labor force participation rate among population between the ages 35 and 44 in the United States with a correlation coefficient (R) of 0.318 and weighted average of 83.3%, a difference of 0.39%.
In Labor Force | Age 35-44 Correlation Summary
| Measurement | Fijian | Immigrants from Honduras |
| Minimum | 50.0% | 64.6% |
| Maximum | 91.2% | 100.0% |
| Range | 41.2% | 35.4% |
| Mean | 79.7% | 83.9% |
| Median | 82.8% | 83.3% |
| Interquartile 25% (IQ1) | 80.9% | 80.3% |
| Interquartile 75% (IQ3) | 84.5% | 85.5% |
| Interquartile Range (IQR) | 3.5% | 5.2% |
| Standard Deviation (Sample) | 10.1% | 7.5% |
| Standard Deviation (Population) | 9.9% | 7.4% |
Demographics Similar to Fijians and Immigrants from Honduras by In Labor Force | Age 35-44
In terms of in labor force | age 35-44, the demographic groups most similar to Fijians are Immigrants from Bangladesh (82.9%, a difference of 0.0%), Immigrants from Belize (82.9%, a difference of 0.0%), Immigrants from Dominican Republic (82.9%, a difference of 0.010%), Osage (82.9%, a difference of 0.020%), and Immigrants from Guatemala (82.9%, a difference of 0.020%). Similarly, the demographic groups most similar to Immigrants from Honduras are French American Indian (83.2%, a difference of 0.0%), Immigrants from Fiji (83.2%, a difference of 0.020%), Spanish (83.2%, a difference of 0.020%), Nonimmigrants (83.2%, a difference of 0.040%), and Hawaiian (83.2%, a difference of 0.060%).
| Demographics | Rating | Rank | In Labor Force | Age 35-44 |
| Guamanians/Chamorros | 0.1 /100 | #267 | Tragic 83.4% |
| Hondurans | 0.1 /100 | #268 | Tragic 83.4% |
| Immigrants | Grenada | 0.1 /100 | #269 | Tragic 83.3% |
| Immigrants | Honduras | 0.0 /100 | #270 | Tragic 83.3% |
| French American Indians | 0.0 /100 | #271 | Tragic 83.2% |
| Immigrants | Fiji | 0.0 /100 | #272 | Tragic 83.2% |
| Spanish | 0.0 /100 | #273 | Tragic 83.2% |
| Immigrants | Nonimmigrants | 0.0 /100 | #274 | Tragic 83.2% |
| Hawaiians | 0.0 /100 | #275 | Tragic 83.2% |
| Delaware | 0.0 /100 | #276 | Tragic 83.2% |
| Samoans | 0.0 /100 | #277 | Tragic 83.2% |
| Belizeans | 0.0 /100 | #278 | Tragic 83.1% |
| Immigrants | Micronesia | 0.0 /100 | #279 | Tragic 83.1% |
| Dominicans | 0.0 /100 | #280 | Tragic 83.1% |
| Guatemalans | 0.0 /100 | #281 | Tragic 83.0% |
| Osage | 0.0 /100 | #282 | Tragic 82.9% |
| Immigrants | Guatemala | 0.0 /100 | #283 | Tragic 82.9% |
| Immigrants | Dominican Republic | 0.0 /100 | #284 | Tragic 82.9% |
| Fijians | 0.0 /100 | #285 | Tragic 82.9% |
| Immigrants | Bangladesh | 0.0 /100 | #286 | Tragic 82.9% |
| Immigrants | Belize | 0.0 /100 | #287 | Tragic 82.9% |