Fijian vs Immigrants from Caribbean Householder Income Ages 25 - 44 years
COMPARE
Fijian
Immigrants from Caribbean
Householder Income Ages 25 - 44 years
Householder Income Ages 25 - 44 years Comparison
Fijians
Immigrants from Caribbean
$79,956
HOUSEHOLDER INCOME AGES 25 - 44 YEARS
0.0/ 100
METRIC RATING
310th/ 347
METRIC RANK
$80,326
HOUSEHOLDER INCOME AGES 25 - 44 YEARS
0.0/ 100
METRIC RATING
304th/ 347
METRIC RANK
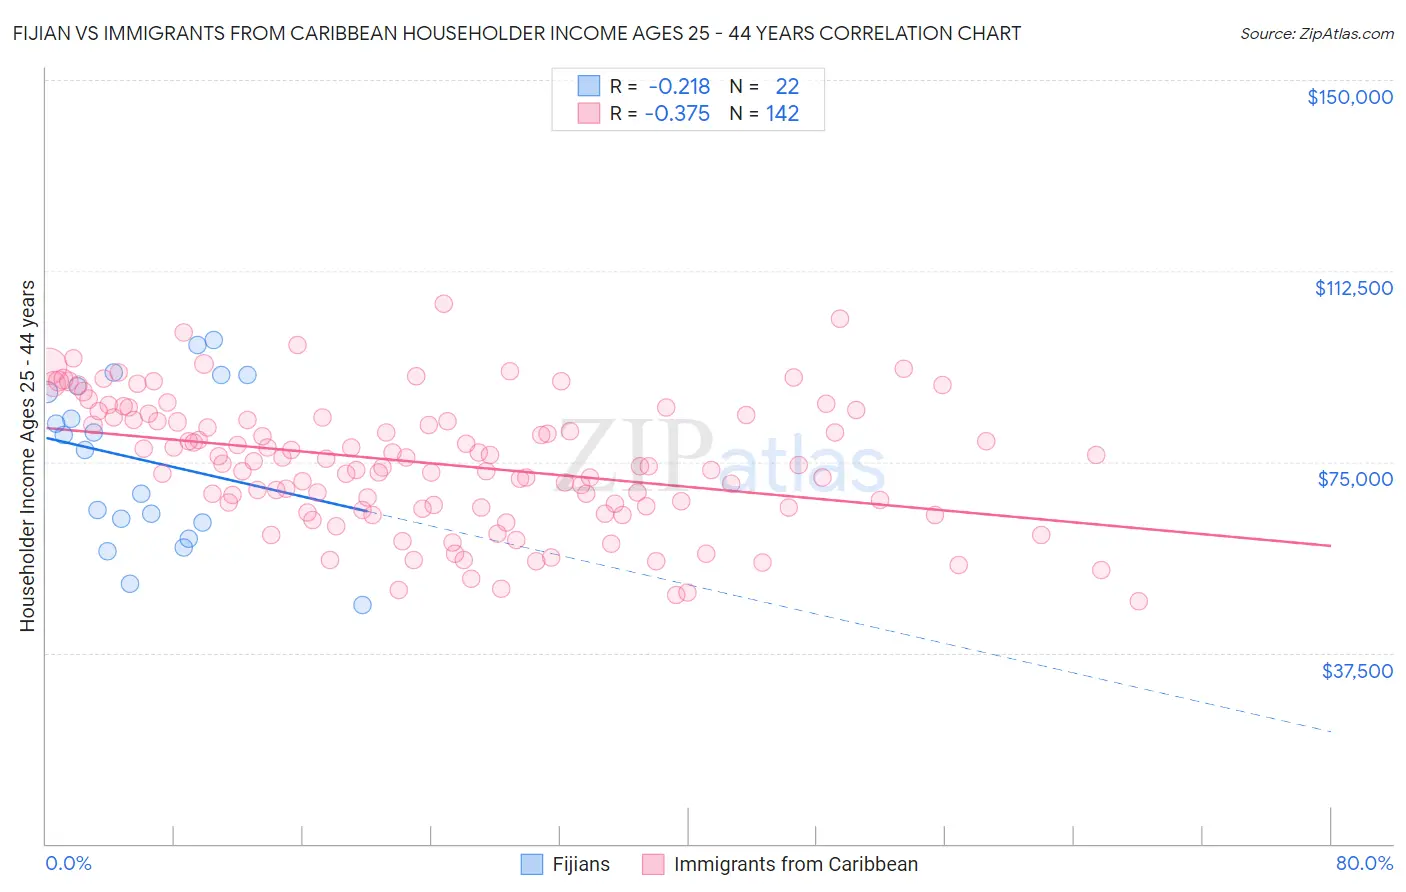
Fijian vs Immigrants from Caribbean Householder Income Ages 25 - 44 years Correlation Chart
The statistical analysis conducted on geographies consisting of 55,935,087 people shows a weak negative correlation between the proportion of Fijians and household income with householder between the ages 25 and 44 in the United States with a correlation coefficient (R) of -0.218 and weighted average of $79,956. Similarly, the statistical analysis conducted on geographies consisting of 448,247,507 people shows a mild negative correlation between the proportion of Immigrants from Caribbean and household income with householder between the ages 25 and 44 in the United States with a correlation coefficient (R) of -0.375 and weighted average of $80,326, a difference of 0.46%.
Householder Income Ages 25 - 44 years Correlation Summary
| Measurement | Fijian | Immigrants from Caribbean |
| Minimum | $46,875 | $47,510 |
| Maximum | $98,958 | $105,938 |
| Range | $52,083 | $58,428 |
| Mean | $75,303 | $74,665 |
| Median | $78,830 | $74,621 |
| Interquartile 25% (IQ1) | $63,125 | $66,150 |
| Interquartile 75% (IQ3) | $89,954 | $83,625 |
| Interquartile Range (IQR) | $26,829 | $17,475 |
| Standard Deviation (Sample) | $15,837 | $12,546 |
| Standard Deviation (Population) | $15,473 | $12,502 |
Demographics Similar to Fijians and Immigrants from Caribbean by Householder Income Ages 25 - 44 years
In terms of householder income ages 25 - 44 years, the demographic groups most similar to Fijians are Chippewa ($80,005, a difference of 0.060%), Immigrants from Central America ($80,012, a difference of 0.070%), Haitian ($80,055, a difference of 0.12%), Apache ($80,260, a difference of 0.38%), and Immigrants from Dominican Republic ($80,319, a difference of 0.45%). Similarly, the demographic groups most similar to Immigrants from Caribbean are Immigrants from Dominican Republic ($80,319, a difference of 0.010%), Apache ($80,260, a difference of 0.080%), Mexican ($80,427, a difference of 0.13%), Hispanic or Latino ($80,515, a difference of 0.24%), and Immigrants from Micronesia ($80,544, a difference of 0.27%).
| Demographics | Rating | Rank | Householder Income Ages 25 - 44 years |
| Immigrants | Guatemala | 0.1 /100 | #297 | Tragic $81,341 |
| Dominicans | 0.1 /100 | #298 | Tragic $81,229 |
| Immigrants | Liberia | 0.1 /100 | #299 | Tragic $80,863 |
| Cherokee | 0.0 /100 | #300 | Tragic $80,843 |
| Immigrants | Micronesia | 0.0 /100 | #301 | Tragic $80,544 |
| Hispanics or Latinos | 0.0 /100 | #302 | Tragic $80,515 |
| Mexicans | 0.0 /100 | #303 | Tragic $80,427 |
| Immigrants | Caribbean | 0.0 /100 | #304 | Tragic $80,326 |
| Immigrants | Dominican Republic | 0.0 /100 | #305 | Tragic $80,319 |
| Apache | 0.0 /100 | #306 | Tragic $80,260 |
| Haitians | 0.0 /100 | #307 | Tragic $80,055 |
| Immigrants | Central America | 0.0 /100 | #308 | Tragic $80,012 |
| Chippewa | 0.0 /100 | #309 | Tragic $80,005 |
| Fijians | 0.0 /100 | #310 | Tragic $79,956 |
| Indonesians | 0.0 /100 | #311 | Tragic $79,543 |
| Immigrants | Haiti | 0.0 /100 | #312 | Tragic $79,391 |
| Menominee | 0.0 /100 | #313 | Tragic $79,358 |
| Cheyenne | 0.0 /100 | #314 | Tragic $79,152 |
| Ottawa | 0.0 /100 | #315 | Tragic $79,012 |
| Africans | 0.0 /100 | #316 | Tragic $78,986 |
| U.S. Virgin Islanders | 0.0 /100 | #317 | Tragic $78,911 |