Ethiopian vs Indian (Asian) In Labor Force | Age > 16
COMPARE
Ethiopian
Indian (Asian)
In Labor Force | Age > 16
In Labor Force | Age > 16 Comparison
Ethiopians
Indians (Asian)
69.3%
IN LABOR FORCE | AGE > 16
100.0/ 100
METRIC RATING
2nd/ 347
METRIC RANK
65.5%
IN LABOR FORCE | AGE > 16
89.5/ 100
METRIC RATING
142nd/ 347
METRIC RANK
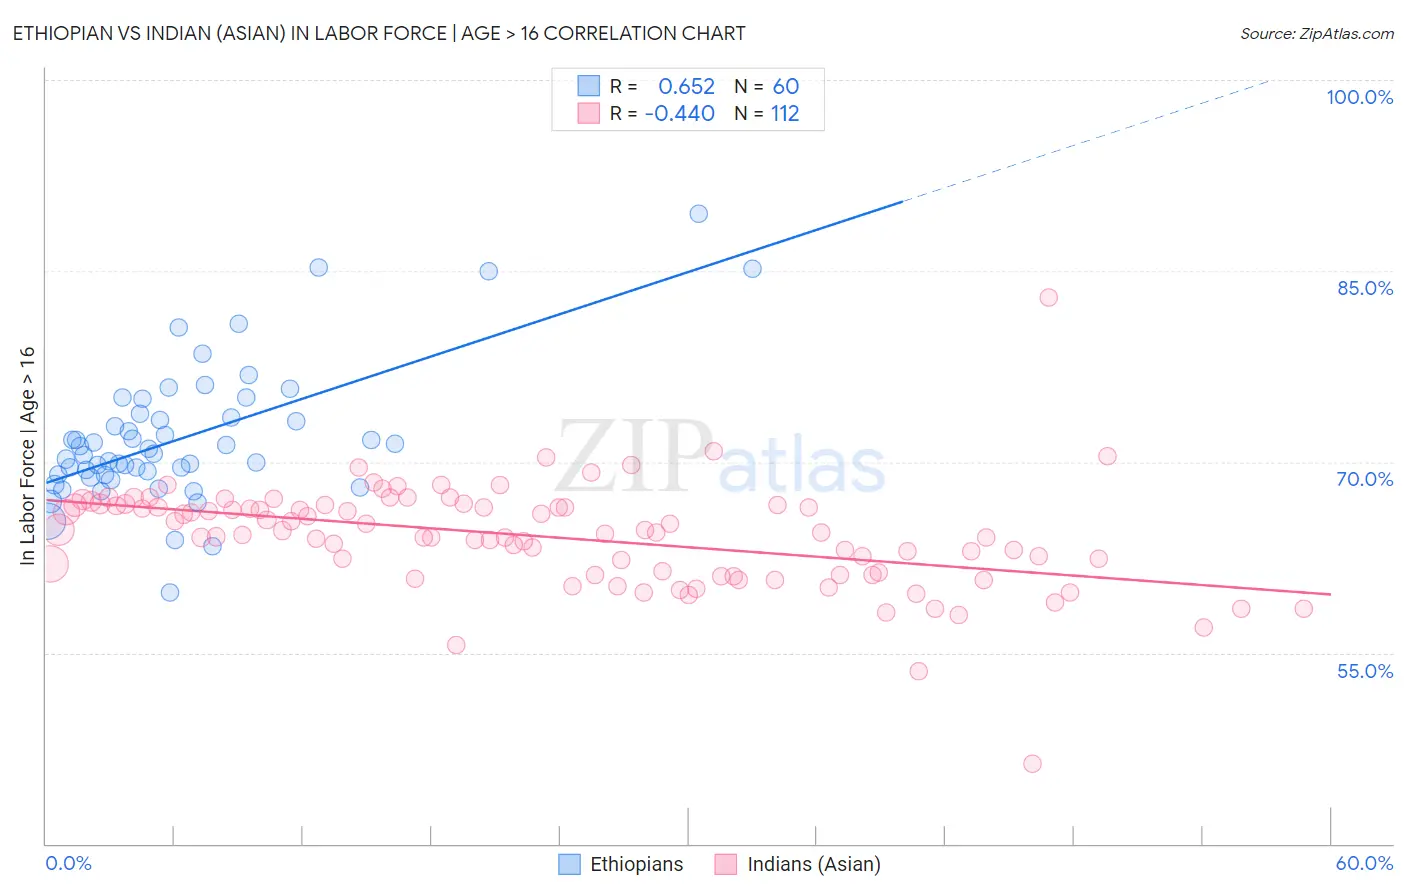
Ethiopian vs Indian (Asian) In Labor Force | Age > 16 Correlation Chart
The statistical analysis conducted on geographies consisting of 223,268,503 people shows a significant positive correlation between the proportion of Ethiopians and labor force participation rate among population ages 16 and over in the United States with a correlation coefficient (R) of 0.652 and weighted average of 69.3%. Similarly, the statistical analysis conducted on geographies consisting of 495,373,057 people shows a moderate negative correlation between the proportion of Indians (Asian) and labor force participation rate among population ages 16 and over in the United States with a correlation coefficient (R) of -0.440 and weighted average of 65.5%, a difference of 5.8%.
In Labor Force | Age > 16 Correlation Summary
| Measurement | Ethiopian | Indian (Asian) |
| Minimum | 59.7% | 46.3% |
| Maximum | 89.5% | 82.9% |
| Range | 29.8% | 36.6% |
| Mean | 71.9% | 64.1% |
| Median | 70.8% | 64.5% |
| Interquartile 25% (IQ1) | 69.0% | 61.3% |
| Interquartile 75% (IQ3) | 73.6% | 66.6% |
| Interquartile Range (IQR) | 4.6% | 5.4% |
| Standard Deviation (Sample) | 5.4% | 4.2% |
| Standard Deviation (Population) | 5.4% | 4.1% |
Similar Demographics by In Labor Force | Age > 16
Demographics Similar to Ethiopians by In Labor Force | Age > 16
In terms of in labor force | age > 16, the demographic groups most similar to Ethiopians are Immigrants from Ethiopia (69.4%, a difference of 0.16%), Somali (69.2%, a difference of 0.20%), Immigrants from Somalia (69.1%, a difference of 0.27%), Sierra Leonean (68.9%, a difference of 0.58%), and Immigrants from Eritrea (68.9%, a difference of 0.63%).
| Demographics | Rating | Rank | In Labor Force | Age > 16 |
| Immigrants | Ethiopia | 100.0 /100 | #1 | Exceptional 69.4% |
| Ethiopians | 100.0 /100 | #2 | Exceptional 69.3% |
| Somalis | 100.0 /100 | #3 | Exceptional 69.2% |
| Immigrants | Somalia | 100.0 /100 | #4 | Exceptional 69.1% |
| Sierra Leoneans | 100.0 /100 | #5 | Exceptional 68.9% |
| Immigrants | Eritrea | 100.0 /100 | #6 | Exceptional 68.9% |
| Immigrants | Cameroon | 100.0 /100 | #7 | Exceptional 68.7% |
| Immigrants | Sierra Leone | 100.0 /100 | #8 | Exceptional 68.5% |
| Immigrants | Eastern Africa | 100.0 /100 | #9 | Exceptional 68.5% |
| Immigrants | Bolivia | 100.0 /100 | #10 | Exceptional 68.4% |
| Bolivians | 100.0 /100 | #11 | Exceptional 68.2% |
| Sudanese | 100.0 /100 | #12 | Exceptional 68.0% |
| Immigrants | Nepal | 100.0 /100 | #13 | Exceptional 68.0% |
| Liberians | 100.0 /100 | #14 | Exceptional 67.8% |
| Immigrants | Middle Africa | 100.0 /100 | #15 | Exceptional 67.7% |
Demographics Similar to Indians (Asian) by In Labor Force | Age > 16
In terms of in labor force | age > 16, the demographic groups most similar to Indians (Asian) are Latvian (65.5%, a difference of 0.0%), Immigrants from Romania (65.5%, a difference of 0.020%), Samoan (65.5%, a difference of 0.030%), Tlingit-Haida (65.5%, a difference of 0.030%), and Immigrants from Taiwan (65.5%, a difference of 0.040%).
| Demographics | Rating | Rank | In Labor Force | Age > 16 |
| Guatemalans | 92.5 /100 | #135 | Exceptional 65.6% |
| Immigrants | Argentina | 92.4 /100 | #136 | Exceptional 65.6% |
| Guamanians/Chamorros | 92.4 /100 | #137 | Exceptional 65.6% |
| Immigrants | West Indies | 92.0 /100 | #138 | Exceptional 65.6% |
| Immigrants | Taiwan | 90.8 /100 | #139 | Exceptional 65.5% |
| Immigrants | Costa Rica | 90.8 /100 | #140 | Exceptional 65.5% |
| Samoans | 90.5 /100 | #141 | Exceptional 65.5% |
| Indians (Asian) | 89.5 /100 | #142 | Excellent 65.5% |
| Latvians | 89.4 /100 | #143 | Excellent 65.5% |
| Immigrants | Romania | 88.6 /100 | #144 | Excellent 65.5% |
| Tlingit-Haida | 88.3 /100 | #145 | Excellent 65.5% |
| Cypriots | 88.2 /100 | #146 | Excellent 65.5% |
| Immigrants | Oceania | 87.5 /100 | #147 | Excellent 65.5% |
| Bhutanese | 86.3 /100 | #148 | Excellent 65.5% |
| Immigrants | Albania | 85.7 /100 | #149 | Excellent 65.4% |