Ethiopian vs Russian In Labor Force | Age > 16
COMPARE
Ethiopian
Russian
In Labor Force | Age > 16
In Labor Force | Age > 16 Comparison
Ethiopians
Russians
69.3%
IN LABOR FORCE | AGE > 16
100.0/ 100
METRIC RATING
2nd/ 347
METRIC RANK
64.9%
IN LABOR FORCE | AGE > 16
18.8/ 100
METRIC RATING
203rd/ 347
METRIC RANK
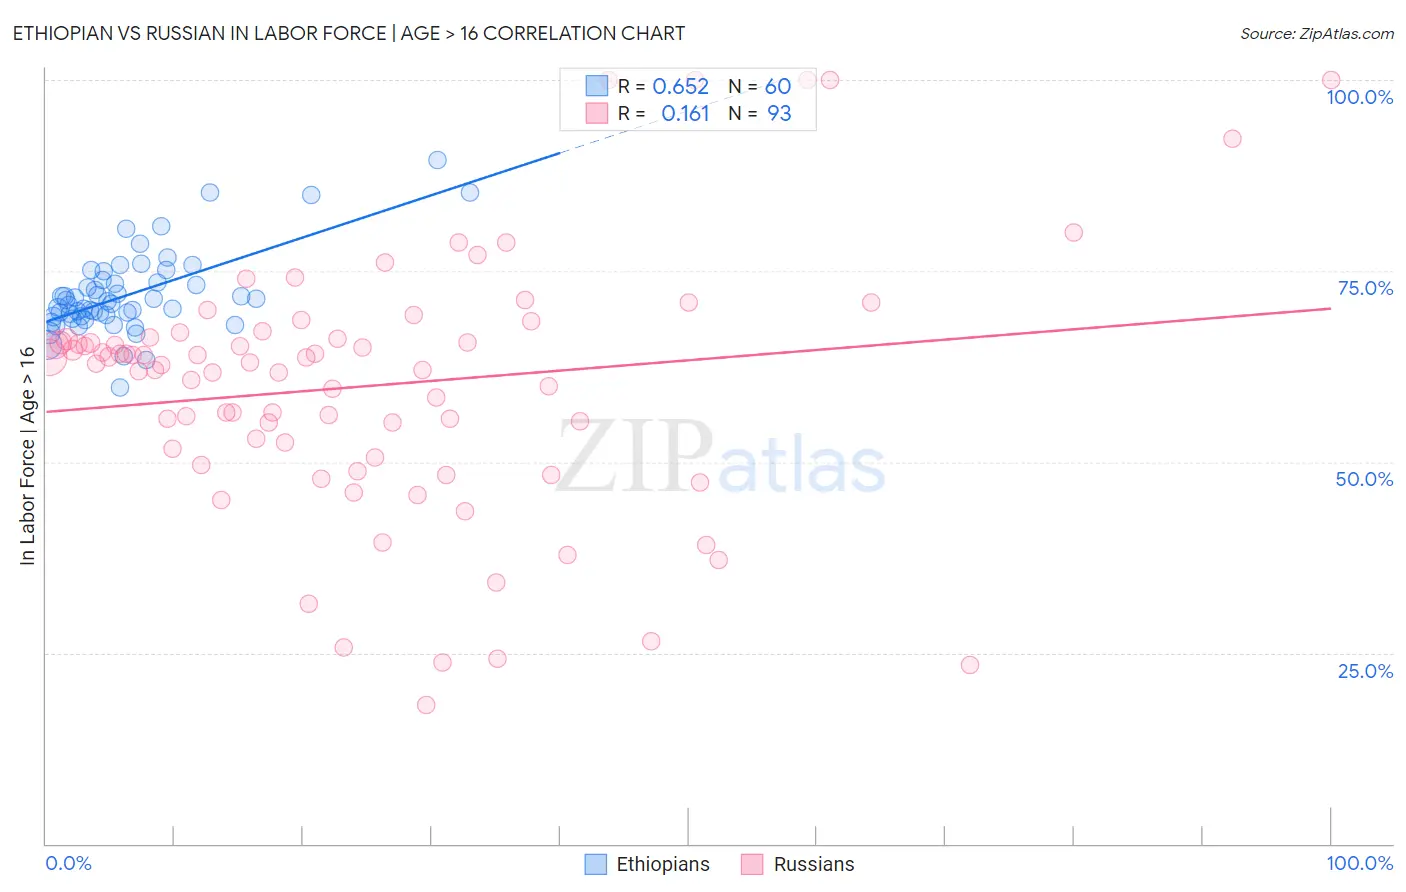
Ethiopian vs Russian In Labor Force | Age > 16 Correlation Chart
The statistical analysis conducted on geographies consisting of 223,268,503 people shows a significant positive correlation between the proportion of Ethiopians and labor force participation rate among population ages 16 and over in the United States with a correlation coefficient (R) of 0.652 and weighted average of 69.3%. Similarly, the statistical analysis conducted on geographies consisting of 512,265,554 people shows a poor positive correlation between the proportion of Russians and labor force participation rate among population ages 16 and over in the United States with a correlation coefficient (R) of 0.161 and weighted average of 64.9%, a difference of 6.9%.
In Labor Force | Age > 16 Correlation Summary
| Measurement | Ethiopian | Russian |
| Minimum | 59.7% | 18.2% |
| Maximum | 89.5% | 100.0% |
| Range | 29.8% | 81.8% |
| Mean | 71.9% | 60.0% |
| Median | 70.8% | 62.9% |
| Interquartile 25% (IQ1) | 69.0% | 51.1% |
| Interquartile 75% (IQ3) | 73.6% | 66.3% |
| Interquartile Range (IQR) | 4.6% | 15.2% |
| Standard Deviation (Sample) | 5.4% | 16.8% |
| Standard Deviation (Population) | 5.4% | 16.7% |
Similar Demographics by In Labor Force | Age > 16
Demographics Similar to Ethiopians by In Labor Force | Age > 16
In terms of in labor force | age > 16, the demographic groups most similar to Ethiopians are Immigrants from Ethiopia (69.4%, a difference of 0.16%), Somali (69.2%, a difference of 0.20%), Immigrants from Somalia (69.1%, a difference of 0.27%), Sierra Leonean (68.9%, a difference of 0.58%), and Immigrants from Eritrea (68.9%, a difference of 0.63%).
| Demographics | Rating | Rank | In Labor Force | Age > 16 |
| Immigrants | Ethiopia | 100.0 /100 | #1 | Exceptional 69.4% |
| Ethiopians | 100.0 /100 | #2 | Exceptional 69.3% |
| Somalis | 100.0 /100 | #3 | Exceptional 69.2% |
| Immigrants | Somalia | 100.0 /100 | #4 | Exceptional 69.1% |
| Sierra Leoneans | 100.0 /100 | #5 | Exceptional 68.9% |
| Immigrants | Eritrea | 100.0 /100 | #6 | Exceptional 68.9% |
| Immigrants | Cameroon | 100.0 /100 | #7 | Exceptional 68.7% |
| Immigrants | Sierra Leone | 100.0 /100 | #8 | Exceptional 68.5% |
| Immigrants | Eastern Africa | 100.0 /100 | #9 | Exceptional 68.5% |
| Immigrants | Bolivia | 100.0 /100 | #10 | Exceptional 68.4% |
| Bolivians | 100.0 /100 | #11 | Exceptional 68.2% |
| Sudanese | 100.0 /100 | #12 | Exceptional 68.0% |
| Immigrants | Nepal | 100.0 /100 | #13 | Exceptional 68.0% |
| Liberians | 100.0 /100 | #14 | Exceptional 67.8% |
| Immigrants | Middle Africa | 100.0 /100 | #15 | Exceptional 67.7% |
Demographics Similar to Russians by In Labor Force | Age > 16
In terms of in labor force | age > 16, the demographic groups most similar to Russians are Slovene (64.9%, a difference of 0.0%), Jamaican (64.9%, a difference of 0.0%), Ukrainian (64.9%, a difference of 0.010%), Immigrants from Belgium (64.9%, a difference of 0.010%), and Armenian (64.9%, a difference of 0.030%).
| Demographics | Rating | Rank | In Labor Force | Age > 16 |
| Haitians | 30.6 /100 | #196 | Fair 65.0% |
| Immigrants | Italy | 28.7 /100 | #197 | Fair 65.0% |
| Greeks | 26.1 /100 | #198 | Fair 64.9% |
| Mexican American Indians | 23.1 /100 | #199 | Fair 64.9% |
| Armenians | 20.2 /100 | #200 | Fair 64.9% |
| Ukrainians | 19.6 /100 | #201 | Poor 64.9% |
| Immigrants | Belgium | 19.4 /100 | #202 | Poor 64.9% |
| Russians | 18.8 /100 | #203 | Poor 64.9% |
| Slovenes | 18.7 /100 | #204 | Poor 64.9% |
| Jamaicans | 18.7 /100 | #205 | Poor 64.9% |
| Lithuanians | 17.4 /100 | #206 | Poor 64.8% |
| Immigrants | Latin America | 16.4 /100 | #207 | Poor 64.8% |
| Belizeans | 16.2 /100 | #208 | Poor 64.8% |
| Immigrants | Trinidad and Tobago | 15.6 /100 | #209 | Poor 64.8% |
| Immigrants | Denmark | 14.7 /100 | #210 | Poor 64.8% |