Ethiopian vs Mexican In Labor Force | Age > 16
COMPARE
Ethiopian
Mexican
In Labor Force | Age > 16
In Labor Force | Age > 16 Comparison
Ethiopians
Mexicans
69.3%
IN LABOR FORCE | AGE > 16
100.0/ 100
METRIC RATING
2nd/ 347
METRIC RANK
64.1%
IN LABOR FORCE | AGE > 16
0.3/ 100
METRIC RATING
275th/ 347
METRIC RANK
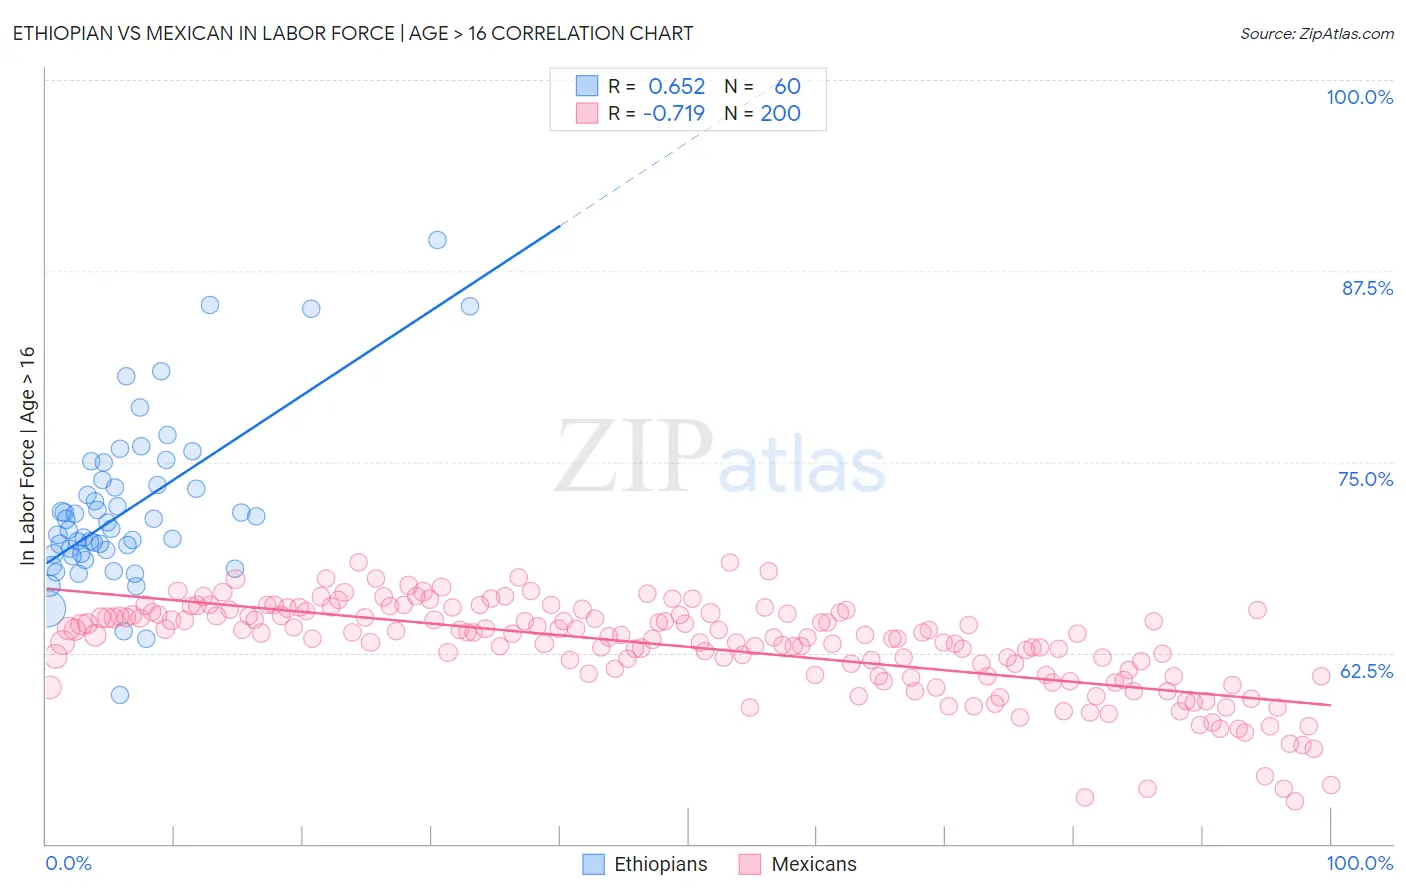
Ethiopian vs Mexican In Labor Force | Age > 16 Correlation Chart
The statistical analysis conducted on geographies consisting of 223,268,503 people shows a significant positive correlation between the proportion of Ethiopians and labor force participation rate among population ages 16 and over in the United States with a correlation coefficient (R) of 0.652 and weighted average of 69.3%. Similarly, the statistical analysis conducted on geographies consisting of 565,326,570 people shows a strong negative correlation between the proportion of Mexicans and labor force participation rate among population ages 16 and over in the United States with a correlation coefficient (R) of -0.719 and weighted average of 64.1%, a difference of 8.2%.
In Labor Force | Age > 16 Correlation Summary
| Measurement | Ethiopian | Mexican |
| Minimum | 59.7% | 52.8% |
| Maximum | 89.5% | 68.4% |
| Range | 29.8% | 15.6% |
| Mean | 71.9% | 62.9% |
| Median | 70.8% | 63.7% |
| Interquartile 25% (IQ1) | 69.0% | 61.0% |
| Interquartile 75% (IQ3) | 73.6% | 65.0% |
| Interquartile Range (IQR) | 4.6% | 4.0% |
| Standard Deviation (Sample) | 5.4% | 3.1% |
| Standard Deviation (Population) | 5.4% | 3.1% |
Similar Demographics by In Labor Force | Age > 16
Demographics Similar to Ethiopians by In Labor Force | Age > 16
In terms of in labor force | age > 16, the demographic groups most similar to Ethiopians are Immigrants from Ethiopia (69.4%, a difference of 0.16%), Somali (69.2%, a difference of 0.20%), Immigrants from Somalia (69.1%, a difference of 0.27%), Sierra Leonean (68.9%, a difference of 0.58%), and Immigrants from Eritrea (68.9%, a difference of 0.63%).
| Demographics | Rating | Rank | In Labor Force | Age > 16 |
| Immigrants | Ethiopia | 100.0 /100 | #1 | Exceptional 69.4% |
| Ethiopians | 100.0 /100 | #2 | Exceptional 69.3% |
| Somalis | 100.0 /100 | #3 | Exceptional 69.2% |
| Immigrants | Somalia | 100.0 /100 | #4 | Exceptional 69.1% |
| Sierra Leoneans | 100.0 /100 | #5 | Exceptional 68.9% |
| Immigrants | Eritrea | 100.0 /100 | #6 | Exceptional 68.9% |
| Immigrants | Cameroon | 100.0 /100 | #7 | Exceptional 68.7% |
| Immigrants | Sierra Leone | 100.0 /100 | #8 | Exceptional 68.5% |
| Immigrants | Eastern Africa | 100.0 /100 | #9 | Exceptional 68.5% |
| Immigrants | Bolivia | 100.0 /100 | #10 | Exceptional 68.4% |
| Bolivians | 100.0 /100 | #11 | Exceptional 68.2% |
| Sudanese | 100.0 /100 | #12 | Exceptional 68.0% |
| Immigrants | Nepal | 100.0 /100 | #13 | Exceptional 68.0% |
| Liberians | 100.0 /100 | #14 | Exceptional 67.8% |
| Immigrants | Middle Africa | 100.0 /100 | #15 | Exceptional 67.7% |
Demographics Similar to Mexicans by In Labor Force | Age > 16
In terms of in labor force | age > 16, the demographic groups most similar to Mexicans are Immigrants from Cuba (64.1%, a difference of 0.0%), French American Indian (64.1%, a difference of 0.0%), Native Hawaiian (64.1%, a difference of 0.020%), Hmong (64.1%, a difference of 0.020%), and Immigrants from Bahamas (64.0%, a difference of 0.030%).
| Demographics | Rating | Rank | In Labor Force | Age > 16 |
| Spaniards | 0.5 /100 | #268 | Tragic 64.1% |
| Irish | 0.4 /100 | #269 | Tragic 64.1% |
| Guyanese | 0.4 /100 | #270 | Tragic 64.1% |
| Dominicans | 0.4 /100 | #271 | Tragic 64.1% |
| Native Hawaiians | 0.3 /100 | #272 | Tragic 64.1% |
| Hmong | 0.3 /100 | #273 | Tragic 64.1% |
| Immigrants | Cuba | 0.3 /100 | #274 | Tragic 64.1% |
| Mexicans | 0.3 /100 | #275 | Tragic 64.1% |
| French American Indians | 0.3 /100 | #276 | Tragic 64.1% |
| Immigrants | Bahamas | 0.3 /100 | #277 | Tragic 64.0% |
| Assyrians/Chaldeans/Syriacs | 0.3 /100 | #278 | Tragic 64.0% |
| Welsh | 0.2 /100 | #279 | Tragic 64.0% |
| Immigrants | St. Vincent and the Grenadines | 0.2 /100 | #280 | Tragic 64.0% |
| French Canadians | 0.2 /100 | #281 | Tragic 64.0% |
| Immigrants | Guyana | 0.2 /100 | #282 | Tragic 64.0% |