Ethiopian vs Cuban In Labor Force | Age 20-24
COMPARE
Ethiopian
Cuban
In Labor Force | Age 20-24
In Labor Force | Age 20-24 Comparison
Ethiopians
Cubans
77.3%
IN LABOR FORCE | AGE 20-24
100.0/ 100
METRIC RATING
47th/ 347
METRIC RANK
72.5%
IN LABOR FORCE | AGE 20-24
0.0/ 100
METRIC RATING
301st/ 347
METRIC RANK
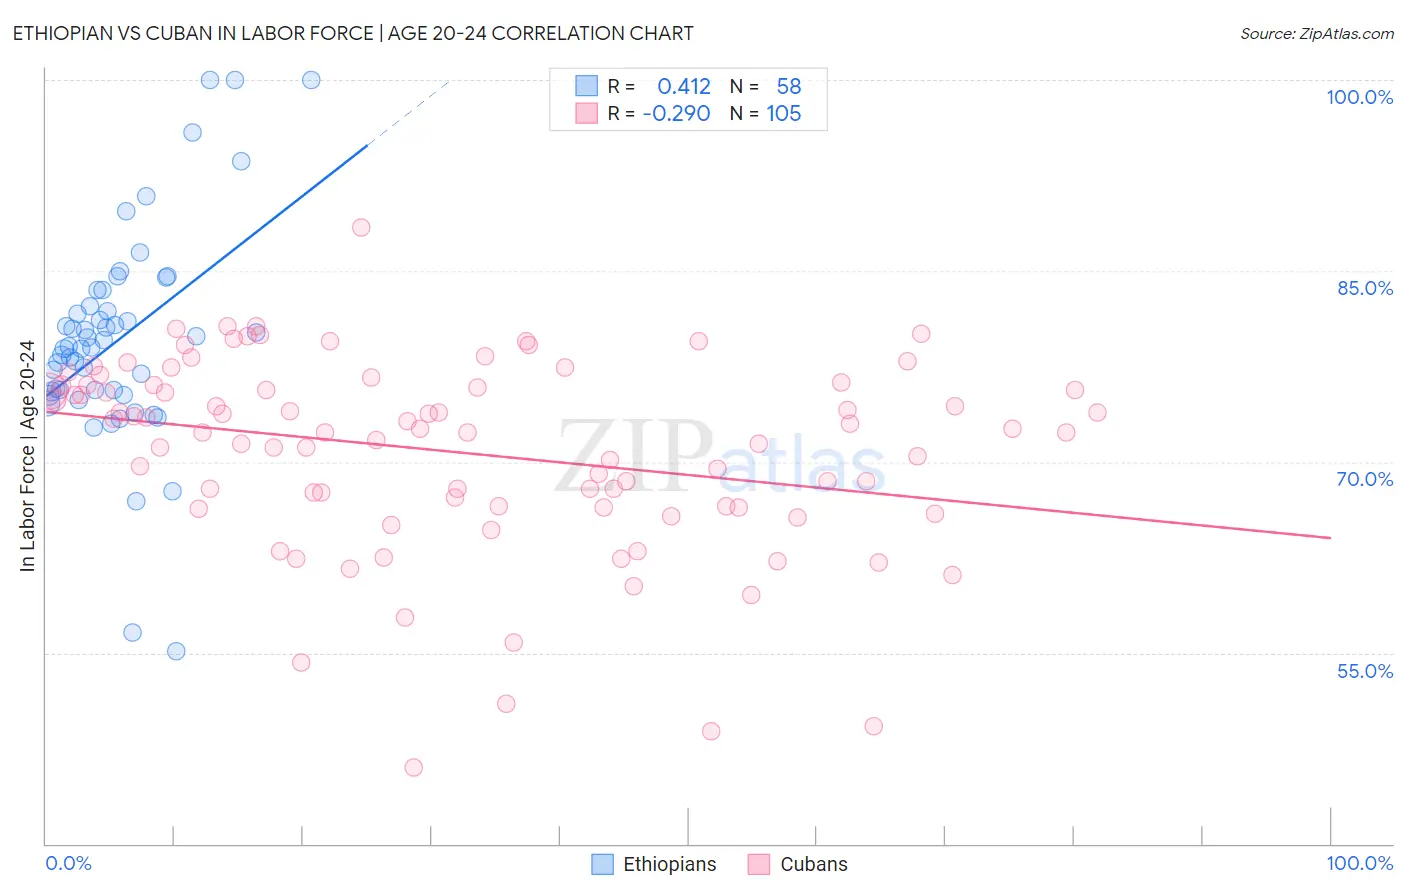
Ethiopian vs Cuban In Labor Force | Age 20-24 Correlation Chart
The statistical analysis conducted on geographies consisting of 223,247,985 people shows a moderate positive correlation between the proportion of Ethiopians and labor force participation rate among population between the ages 20 and 24 in the United States with a correlation coefficient (R) of 0.412 and weighted average of 77.3%. Similarly, the statistical analysis conducted on geographies consisting of 449,113,848 people shows a weak negative correlation between the proportion of Cubans and labor force participation rate among population between the ages 20 and 24 in the United States with a correlation coefficient (R) of -0.290 and weighted average of 72.5%, a difference of 6.6%.
In Labor Force | Age 20-24 Correlation Summary
| Measurement | Ethiopian | Cuban |
| Minimum | 55.1% | 46.0% |
| Maximum | 100.0% | 88.4% |
| Range | 44.9% | 42.4% |
| Mean | 79.6% | 70.8% |
| Median | 79.0% | 72.4% |
| Interquartile 25% (IQ1) | 75.5% | 66.4% |
| Interquartile 75% (IQ3) | 82.2% | 76.0% |
| Interquartile Range (IQR) | 6.7% | 9.6% |
| Standard Deviation (Sample) | 8.4% | 7.6% |
| Standard Deviation (Population) | 8.3% | 7.6% |
Similar Demographics by In Labor Force | Age 20-24
Demographics Similar to Ethiopians by In Labor Force | Age 20-24
In terms of in labor force | age 20-24, the demographic groups most similar to Ethiopians are Serbian (77.3%, a difference of 0.050%), Samoan (77.4%, a difference of 0.060%), Chinese (77.3%, a difference of 0.060%), Native Hawaiian (77.4%, a difference of 0.070%), and Fijian (77.4%, a difference of 0.080%).
| Demographics | Rating | Rank | In Labor Force | Age 20-24 |
| Scottish | 100.0 /100 | #40 | Exceptional 77.4% |
| Immigrants | Congo | 100.0 /100 | #41 | Exceptional 77.4% |
| French | 100.0 /100 | #42 | Exceptional 77.4% |
| Immigrants | Laos | 100.0 /100 | #43 | Exceptional 77.4% |
| Fijians | 100.0 /100 | #44 | Exceptional 77.4% |
| Native Hawaiians | 100.0 /100 | #45 | Exceptional 77.4% |
| Samoans | 100.0 /100 | #46 | Exceptional 77.4% |
| Ethiopians | 100.0 /100 | #47 | Exceptional 77.3% |
| Serbians | 100.0 /100 | #48 | Exceptional 77.3% |
| Chinese | 100.0 /100 | #49 | Exceptional 77.3% |
| Malaysians | 100.0 /100 | #50 | Exceptional 77.2% |
| Croatians | 100.0 /100 | #51 | Exceptional 77.2% |
| Indonesians | 100.0 /100 | #52 | Exceptional 77.2% |
| Immigrants | Azores | 100.0 /100 | #53 | Exceptional 77.2% |
| Celtics | 99.9 /100 | #54 | Exceptional 77.1% |
Demographics Similar to Cubans by In Labor Force | Age 20-24
In terms of in labor force | age 20-24, the demographic groups most similar to Cubans are Armenian (72.5%, a difference of 0.070%), Iranian (72.6%, a difference of 0.090%), Native/Alaskan (72.4%, a difference of 0.090%), Ecuadorian (72.4%, a difference of 0.10%), and Immigrants from West Indies (72.4%, a difference of 0.11%).
| Demographics | Rating | Rank | In Labor Force | Age 20-24 |
| Immigrants | Argentina | 0.0 /100 | #294 | Tragic 72.8% |
| Okinawans | 0.0 /100 | #295 | Tragic 72.7% |
| Jamaicans | 0.0 /100 | #296 | Tragic 72.7% |
| Central American Indians | 0.0 /100 | #297 | Tragic 72.7% |
| Israelis | 0.0 /100 | #298 | Tragic 72.6% |
| Iranians | 0.0 /100 | #299 | Tragic 72.6% |
| Armenians | 0.0 /100 | #300 | Tragic 72.5% |
| Cubans | 0.0 /100 | #301 | Tragic 72.5% |
| Natives/Alaskans | 0.0 /100 | #302 | Tragic 72.4% |
| Ecuadorians | 0.0 /100 | #303 | Tragic 72.4% |
| Immigrants | West Indies | 0.0 /100 | #304 | Tragic 72.4% |
| Immigrants | Singapore | 0.0 /100 | #305 | Tragic 72.4% |
| Immigrants | Jamaica | 0.0 /100 | #306 | Tragic 72.4% |
| Immigrants | Ecuador | 0.0 /100 | #307 | Tragic 72.3% |
| Soviet Union | 0.0 /100 | #308 | Tragic 72.3% |