Ethiopian vs Immigrants from Taiwan In Labor Force | Age 20-24
COMPARE
Ethiopian
Immigrants from Taiwan
In Labor Force | Age 20-24
In Labor Force | Age 20-24 Comparison
Ethiopians
Immigrants from Taiwan
77.3%
IN LABOR FORCE | AGE 20-24
100.0/ 100
METRIC RATING
47th/ 347
METRIC RANK
71.5%
IN LABOR FORCE | AGE 20-24
0.0/ 100
METRIC RATING
321st/ 347
METRIC RANK
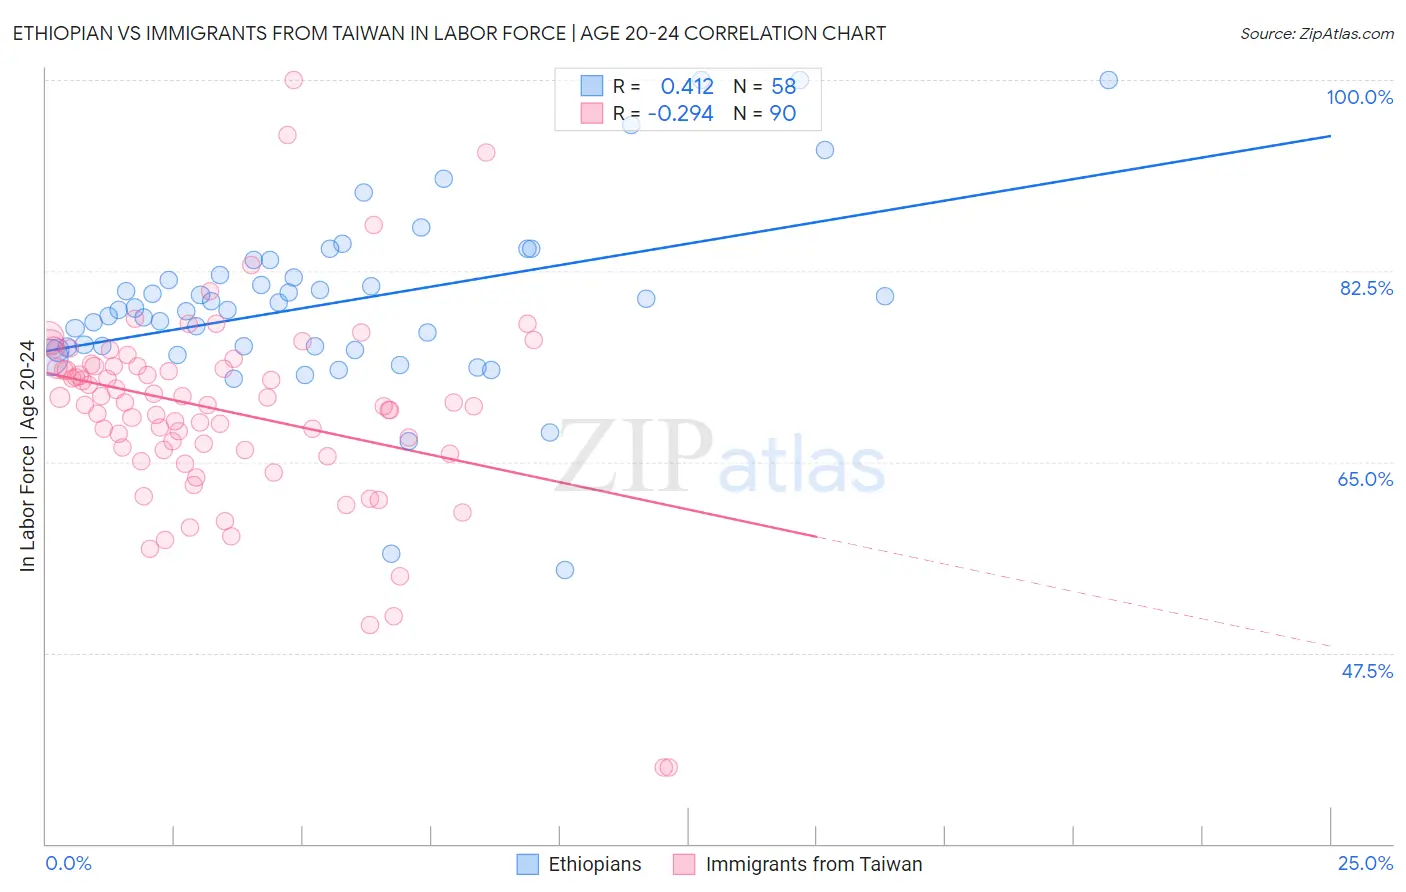
Ethiopian vs Immigrants from Taiwan In Labor Force | Age 20-24 Correlation Chart
The statistical analysis conducted on geographies consisting of 223,247,985 people shows a moderate positive correlation between the proportion of Ethiopians and labor force participation rate among population between the ages 20 and 24 in the United States with a correlation coefficient (R) of 0.412 and weighted average of 77.3%. Similarly, the statistical analysis conducted on geographies consisting of 298,185,323 people shows a weak negative correlation between the proportion of Immigrants from Taiwan and labor force participation rate among population between the ages 20 and 24 in the United States with a correlation coefficient (R) of -0.294 and weighted average of 71.5%, a difference of 8.1%.
In Labor Force | Age 20-24 Correlation Summary
| Measurement | Ethiopian | Immigrants from Taiwan |
| Minimum | 55.1% | 37.0% |
| Maximum | 100.0% | 100.0% |
| Range | 44.9% | 63.0% |
| Mean | 79.6% | 69.7% |
| Median | 79.0% | 70.3% |
| Interquartile 25% (IQ1) | 75.5% | 66.1% |
| Interquartile 75% (IQ3) | 82.2% | 73.8% |
| Interquartile Range (IQR) | 6.7% | 7.7% |
| Standard Deviation (Sample) | 8.4% | 9.4% |
| Standard Deviation (Population) | 8.3% | 9.4% |
Similar Demographics by In Labor Force | Age 20-24
Demographics Similar to Ethiopians by In Labor Force | Age 20-24
In terms of in labor force | age 20-24, the demographic groups most similar to Ethiopians are Serbian (77.3%, a difference of 0.050%), Samoan (77.4%, a difference of 0.060%), Chinese (77.3%, a difference of 0.060%), Native Hawaiian (77.4%, a difference of 0.070%), and Fijian (77.4%, a difference of 0.080%).
| Demographics | Rating | Rank | In Labor Force | Age 20-24 |
| Scottish | 100.0 /100 | #40 | Exceptional 77.4% |
| Immigrants | Congo | 100.0 /100 | #41 | Exceptional 77.4% |
| French | 100.0 /100 | #42 | Exceptional 77.4% |
| Immigrants | Laos | 100.0 /100 | #43 | Exceptional 77.4% |
| Fijians | 100.0 /100 | #44 | Exceptional 77.4% |
| Native Hawaiians | 100.0 /100 | #45 | Exceptional 77.4% |
| Samoans | 100.0 /100 | #46 | Exceptional 77.4% |
| Ethiopians | 100.0 /100 | #47 | Exceptional 77.3% |
| Serbians | 100.0 /100 | #48 | Exceptional 77.3% |
| Chinese | 100.0 /100 | #49 | Exceptional 77.3% |
| Malaysians | 100.0 /100 | #50 | Exceptional 77.2% |
| Croatians | 100.0 /100 | #51 | Exceptional 77.2% |
| Indonesians | 100.0 /100 | #52 | Exceptional 77.2% |
| Immigrants | Azores | 100.0 /100 | #53 | Exceptional 77.2% |
| Celtics | 99.9 /100 | #54 | Exceptional 77.1% |
Demographics Similar to Immigrants from Taiwan by In Labor Force | Age 20-24
In terms of in labor force | age 20-24, the demographic groups most similar to Immigrants from Taiwan are Trinidadian and Tobagonian (71.5%, a difference of 0.050%), Immigrants from Israel (71.6%, a difference of 0.13%), Filipino (71.4%, a difference of 0.13%), Immigrants from Hong Kong (71.6%, a difference of 0.16%), and Immigrants from Armenia (71.7%, a difference of 0.25%).
| Demographics | Rating | Rank | In Labor Force | Age 20-24 |
| Indians (Asian) | 0.0 /100 | #314 | Tragic 71.9% |
| Immigrants | Iran | 0.0 /100 | #315 | Tragic 71.8% |
| Immigrants | Eastern Asia | 0.0 /100 | #316 | Tragic 71.8% |
| Immigrants | Armenia | 0.0 /100 | #317 | Tragic 71.7% |
| Immigrants | Hong Kong | 0.0 /100 | #318 | Tragic 71.6% |
| Immigrants | Israel | 0.0 /100 | #319 | Tragic 71.6% |
| Trinidadians and Tobagonians | 0.0 /100 | #320 | Tragic 71.5% |
| Immigrants | Taiwan | 0.0 /100 | #321 | Tragic 71.5% |
| Filipinos | 0.0 /100 | #322 | Tragic 71.4% |
| West Indians | 0.0 /100 | #323 | Tragic 71.3% |
| Immigrants | Dominican Republic | 0.0 /100 | #324 | Tragic 71.2% |
| Barbadians | 0.0 /100 | #325 | Tragic 71.1% |
| Dominicans | 0.0 /100 | #326 | Tragic 71.1% |
| Immigrants | Trinidad and Tobago | 0.0 /100 | #327 | Tragic 71.1% |
| Immigrants | China | 0.0 /100 | #328 | Tragic 71.1% |