Ethiopian vs Immigrants from Zaire In Labor Force | Age 20-24
COMPARE
Ethiopian
Immigrants from Zaire
In Labor Force | Age 20-24
In Labor Force | Age 20-24 Comparison
Ethiopians
Immigrants from Zaire
77.3%
IN LABOR FORCE | AGE 20-24
100.0/ 100
METRIC RATING
47th/ 347
METRIC RANK
76.6%
IN LABOR FORCE | AGE 20-24
99.6/ 100
METRIC RATING
79th/ 347
METRIC RANK
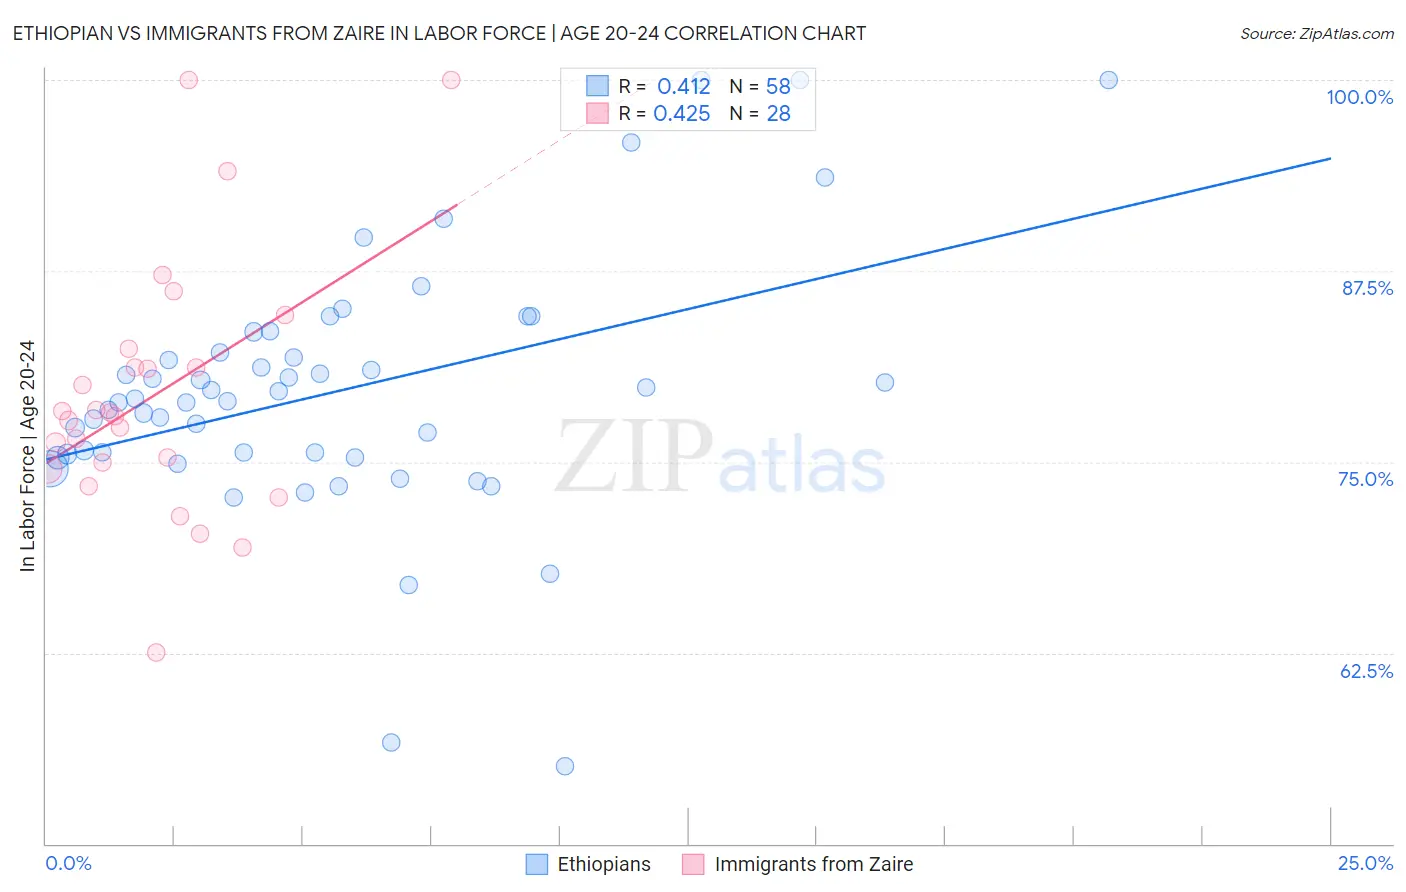
Ethiopian vs Immigrants from Zaire In Labor Force | Age 20-24 Correlation Chart
The statistical analysis conducted on geographies consisting of 223,247,985 people shows a moderate positive correlation between the proportion of Ethiopians and labor force participation rate among population between the ages 20 and 24 in the United States with a correlation coefficient (R) of 0.412 and weighted average of 77.3%. Similarly, the statistical analysis conducted on geographies consisting of 107,224,188 people shows a moderate positive correlation between the proportion of Immigrants from Zaire and labor force participation rate among population between the ages 20 and 24 in the United States with a correlation coefficient (R) of 0.425 and weighted average of 76.6%, a difference of 0.97%.
In Labor Force | Age 20-24 Correlation Summary
| Measurement | Ethiopian | Immigrants from Zaire |
| Minimum | 55.1% | 62.5% |
| Maximum | 100.0% | 100.0% |
| Range | 44.9% | 37.5% |
| Mean | 79.6% | 79.4% |
| Median | 79.0% | 78.1% |
| Interquartile 25% (IQ1) | 75.5% | 74.7% |
| Interquartile 75% (IQ3) | 82.2% | 81.8% |
| Interquartile Range (IQR) | 6.7% | 7.1% |
| Standard Deviation (Sample) | 8.4% | 8.4% |
| Standard Deviation (Population) | 8.3% | 8.3% |
Similar Demographics by In Labor Force | Age 20-24
Demographics Similar to Ethiopians by In Labor Force | Age 20-24
In terms of in labor force | age 20-24, the demographic groups most similar to Ethiopians are Serbian (77.3%, a difference of 0.050%), Samoan (77.4%, a difference of 0.060%), Chinese (77.3%, a difference of 0.060%), Native Hawaiian (77.4%, a difference of 0.070%), and Fijian (77.4%, a difference of 0.080%).
| Demographics | Rating | Rank | In Labor Force | Age 20-24 |
| Scottish | 100.0 /100 | #40 | Exceptional 77.4% |
| Immigrants | Congo | 100.0 /100 | #41 | Exceptional 77.4% |
| French | 100.0 /100 | #42 | Exceptional 77.4% |
| Immigrants | Laos | 100.0 /100 | #43 | Exceptional 77.4% |
| Fijians | 100.0 /100 | #44 | Exceptional 77.4% |
| Native Hawaiians | 100.0 /100 | #45 | Exceptional 77.4% |
| Samoans | 100.0 /100 | #46 | Exceptional 77.4% |
| Ethiopians | 100.0 /100 | #47 | Exceptional 77.3% |
| Serbians | 100.0 /100 | #48 | Exceptional 77.3% |
| Chinese | 100.0 /100 | #49 | Exceptional 77.3% |
| Malaysians | 100.0 /100 | #50 | Exceptional 77.2% |
| Croatians | 100.0 /100 | #51 | Exceptional 77.2% |
| Indonesians | 100.0 /100 | #52 | Exceptional 77.2% |
| Immigrants | Azores | 100.0 /100 | #53 | Exceptional 77.2% |
| Celtics | 99.9 /100 | #54 | Exceptional 77.1% |
Demographics Similar to Immigrants from Zaire by In Labor Force | Age 20-24
In terms of in labor force | age 20-24, the demographic groups most similar to Immigrants from Zaire are Immigrants from Cameroon (76.6%, a difference of 0.020%), Canadian (76.6%, a difference of 0.020%), Italian (76.5%, a difference of 0.030%), Basque (76.5%, a difference of 0.040%), and Hmong (76.5%, a difference of 0.040%).
| Demographics | Rating | Rank | In Labor Force | Age 20-24 |
| Guamanians/Chamorros | 99.8 /100 | #72 | Exceptional 76.7% |
| British | 99.8 /100 | #73 | Exceptional 76.7% |
| Cree | 99.7 /100 | #74 | Exceptional 76.6% |
| Immigrants | Middle Africa | 99.7 /100 | #75 | Exceptional 76.6% |
| Immigrants | Moldova | 99.6 /100 | #76 | Exceptional 76.6% |
| Immigrants | Cameroon | 99.6 /100 | #77 | Exceptional 76.6% |
| Canadians | 99.6 /100 | #78 | Exceptional 76.6% |
| Immigrants | Zaire | 99.6 /100 | #79 | Exceptional 76.6% |
| Italians | 99.6 /100 | #80 | Exceptional 76.5% |
| Basques | 99.5 /100 | #81 | Exceptional 76.5% |
| Hmong | 99.5 /100 | #82 | Exceptional 76.5% |
| Carpatho Rusyns | 99.4 /100 | #83 | Exceptional 76.5% |
| Austrians | 99.4 /100 | #84 | Exceptional 76.5% |
| Portuguese | 99.3 /100 | #85 | Exceptional 76.4% |
| Immigrants | Iraq | 99.3 /100 | #86 | Exceptional 76.4% |